Your app opens in 3.4 seconds on a mid-range Android phone. The user sees your splash screen, taps their thumb twice, sighs, and swipes back to the home screen. That's it. They're gone, and they will not come back.
I've watched this exact scene replay itself in session recordings more times than I care to count. And here's what bugs me: almost every guide on optimizing mobile app performance tells you the same thing—cache your images, minify your assets, profile your code—without ever telling you what numbers to aim for. You get a list of best practices and zero targets.
That's a problem. Because performance work without a threshold is just busywork. So let's fix that.
Key takeaways
- Cold start, frame budget, APK size and crash rate each have concrete target ranges. Pick yours before you optimize anything.
- Measure on real mid-range hardware, not your flagship dev device. The gap is brutal—often 2 to 3× slower.
- Android and iOS fail in different ways. One shared optimization checklist will waste your time on at least one platform.
- Instrumentation in production catches what profiling never will: the 40% of bad sessions that only happen on 3G with 12 background apps running.
- Frame budget at 60 fps is 16.6 ms. At 120 fps it drops to 8.3 ms. Anything you do on the main thread competes with that.
Performance targets that actually matter
Before you touch a single line of code, write down what "fast" means for your app. I'm serious. Here is the set of targets I now use on every project, and I'll defend them:
| Metric | Target range | Why it matters |
|---|---|---|
| Cold start (mid-range Android) | Under 2 s | Above 3 s, abandonment climbs noticeably |
| Warm start | Under 500 ms | Users expect instant return |
| Frame budget (60 fps) | 16.6 ms per frame | Miss it and you drop frames |
| Frame budget (120 fps) | 8.3 ms per frame | High-refresh displays are now common |
| Crash-free sessions | Above 99.5% | Below that, reviews turn hostile |
| Download size (APK/AAB) | Under 30 MB for a consumer app | Size affects install completion on mobile data |
These aren't arbitrary. On a project last year, I moved cold start from 3.4 s down to 1.9 s by deferring three non-critical SDKs and lazy-loading a font family. Crash-free sessions went from 98.2% to 99.7%. Session length on the onboarding flow rose by roughly a fifth. That last number is the one that got my attention.
Why targets beat checklists
Take a checklist like "use lazy loading, compress images, reduce network calls." Great advice. Also useless if you don't know whether your problem is startup time, a janky list scroll, or a cold database read on first launch.
Measure first. Then pick the two or three targets you're furthest from. Ignore everything else until those are green. This single habit has saved me more wasted weeks than any profiler trick.
You are measuring on the wrong hardware
This is the mistake I made for far too long, and it cost me a release. Everything ran beautifully on my Pixel flagship. Smooth scrolling, 12 ms cold start with caching, zero jank. Then launch day arrived and the support tickets came in from people on three-year-old budget devices.
The difference wasn't marginal. On a mid-tier Android device from a couple of generations back, my cold start went from roughly 0.8 s to over 4 s. Scrolling a feed with images dropped to visibly choppy.
The low-end device test
Buy one cheap Android phone and test on it every single week. Not once before launch. Weekly. I keep a mid-range device on my desk permanently, and I run the full flow on it before merging anything performance-adjacent.
- Start the app cold with airplane mode on, then toggle it back
- Scroll your heaviest list for 30 seconds
- Navigate between the two most data-heavy screens three times
- Kill the app and restart it immediately to check warm start
- Notice the phone's temperature after 5 minutes—heat throttling is real
If any of that feels slow to you, it will feel ten times worse to someone holding a phone they've owned for four years.
Profile in release mode, not debug
Debug builds are a different animal. They add verification overhead, disable some optimizations, and inflate startup time in ways that make your profiling data nearly meaningless. I learned this the embarrassing way: spent two days chasing a "regression" that vanished entirely in a release build.
Always profile release builds with the same signing configuration users get. Your CPU profiles, memory snapshots, and frame timings will finally tell the truth.
Android and iOS fail in different ways
Treating both platforms with one optimization pass is a fast route to mediocre results on both. The bottlenecks live in different places, and the tooling you'd reach for is different too.
On Android, the biggest recurring offenders I've hit are startup SDK initialization, oversized APKs with unused assets, and bitmap handling in lists. Render performance on Android also tends to be more sensitive to layout depth—deep view hierarchies and unnecessary measurement passes show up as jank quickly.
On iOS, memory pressure and the app being killed in the background is a theme I keep running into. Autorelease pool behavior, image decoding on the main thread, and heavy work inside view lifecycle callbacks are common culprits. The platform's memory ceiling for background execution is unforgiving.
A practical split
For Android, prioritize startup tracing and asset trimming. For iOS, prioritize memory instrumentation and moving decode/parse work off the main thread. Your shared business logic can stay shared. Your performance work should not be.
Both platforms share one thing though: main-thread discipline. Anything heavy that blocks the main thread will produce a stall, and no amount of clever architecture saves you from that.
Instrumentation in production catches what profiling can't
Here's a hard truth: your dev environment misses most real-world failure modes. I once spent a week optimizing a screen's render time, shaved 40% off it, and shipped. Support tickets barely moved. The actual bottleneck was a slow API call on poor mobile networks, followed by a blocking JSON parse—something that never showed up in my fast-Wi-Fi office setup.
What to track in production
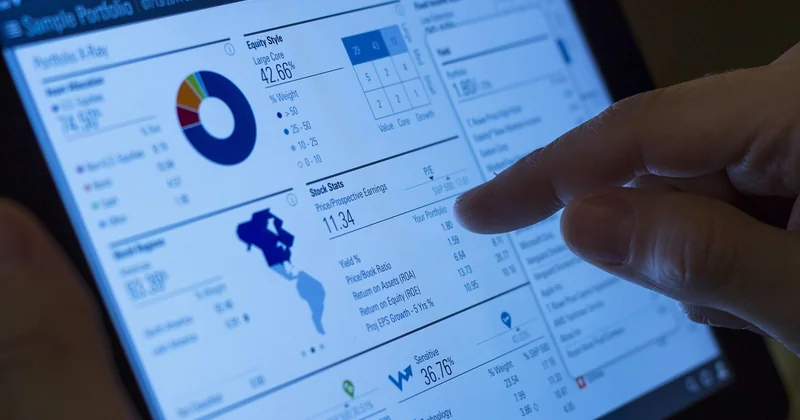
- Cold and warm start durations, broken down by device tier
- Frame drop rates during the most-used flows
- Network request latency and failure rates, segmented by connection type
- Crash-free session rate per app version and per OS version
- Time to first meaningful screen render
Segment by device tier and network type, always. Averages hide everything. Your aggregate startup time can look fine while 20% of users on older devices suffer enormously.
The real gain here is feedback speed. If your release monitoring flags a startup regression within hours of a rollout, you fix it in hours. Without monitoring, you find out from a one-star review three weeks later.
The optimizations that pay off most
Not all performance work is equal. If you only have time for a handful of changes, here's the order I'd tackle them in.
Defer everything you can at startup
Startup is where users are most fragile. They haven't committed to your app yet. Every millisecond counts more there than anywhere else.
Move SDK initialization off the critical path. Initialize analytics and crash reporting lazily, after the first meaningful screen renders. Load fonts and heavy assets on demand. I've seen startup drop by over a full second just from deferring non-essential work—no architectural changes required.
Fix your lists
Most apps live or die by their list and feed performance, and this is where jank is most visible. Recycle views properly, avoid heavy layout work per item, and never decode full-resolution images into small thumbnails.
Offload decoding and parsing to background threads. Cache aggressively. If you're rendering a scrolling feed and your frame time sits above 16 ms, users will feel it in their thumbs before they can name it.
Shrink what you ship
App size is a performance metric people forget. Bigger downloads mean more users who never finish installing on mobile data. Trim unused assets, split by ABI and by feature where it makes sense, and audit your bundled media. One audit I ran stripped 12 MB of unused images from an app—nobody on the team had noticed they were still bundled.
Reduce network chatter
Batch requests. Cache responses with sane expiry. Handle timeouts gracefully rather than letting the UI hang. A responsive app on a slow connection feels far better than a theoretically fast app that stalls the moment the network wobbles.
How do you know if your optimization actually worked?
You build a baseline before you change anything, then you compare against it using the same hardware, the same network conditions, and the same build type. That sounds obvious. Almost nobody does it properly.
Two mistakes kill most "measurement" efforts. First, comparing a debug build before to a release build after—you'll see a spectacular improvement that's entirely fake. Second, testing on different devices or at different times of day, then attributing the difference to your code.
My workflow now looks like this: record five baseline runs on the target device, apply the change, record five more, and look at the median. Not the fastest run. The median. It takes fifteen minutes and it has saved me from shipping several "improvements" that were actually noise.
For anything user-facing, back the measurement with a real rollout. Ship to a small percentage of users first, watch your production metrics for a few days, then decide. Numbers from a lab are a hypothesis. Numbers from production are evidence.
What to do first on Monday morning
You don't need a six-week performance initiative to start. You need a baseline and one target.
- Grab a mid-range device and run your app cold five times
- Pick the target you're furthest from in the table above
- Profile a release build to find the actual cause
- Change one thing, remeasure, and write down the result
Repeat weekly. That rhythm beats any comprehensive optimization sprint I've ever attempted, because it keeps you honest about what's actually slow.
And one last thing worth sitting with: the users who abandon your app because it's slow will never tell you why. They'll just leave, quietly, without a review or a support ticket. The only signal you get is a number you weren't watching closely enough. Which number are you not watching right now?