


With the increasing popularity of AMP, web performance on mobile has become a mainstream issue discussed even by non-tech media. If you’re looking to better understand the problem, here is a ready-made list of 13 recent statistics related to web performance on mobile.
As mobiForge’s Ronan Cremin recently put it, today the world of mobile web design seems very close to the way it was in the 1990s with many websites offering made-for-mobile experiences, rather than responsive. It is apparent that businesses are beginning to understand that the “classic” one-size-fits-all approach causes more problems than benefits. In other words, the lack of device-focused optimization means that most of us experience awfully slow loading times on our phones, even on high-end devices connected to a fast network.
Here we collected 13 recent statistics which show the importance of focusing on mobile web performance in 2017.
1. The average page weight is over 2.3MB
Here on mobiForge we ran a quick research on how large today’s websites are. In April 2016 it was 2MB on average which was, as Ronan put it, as big as the original Doom’s install image.
A year later the average page weight is still growing. According to httparchive.org now it is over 2.3MB!
2. 53% of mobile users abandon websites that take longer than 3 seconds to load
According to a report by Google published in September 2016, as much as 53% of mobile users abandon websites that take longer than 3 seconds to load. The report is based on research covering 10,000+ mobile web domains.
Source: 1
3. The average loading time on mobile is 19 seconds
Given the fact that the average website weighs over 2.3MB, it’s not a big surprise that in less than perfect conditions websites are awfully slow to load on mobile. According to Google, it takes 19 seconds on average to load a website on a phone connected to a 3G network.
The level of disappointment caused by slow loading times can be underlined by the fact that 1 out of 2 people expect a page to load in less than 2 seconds.
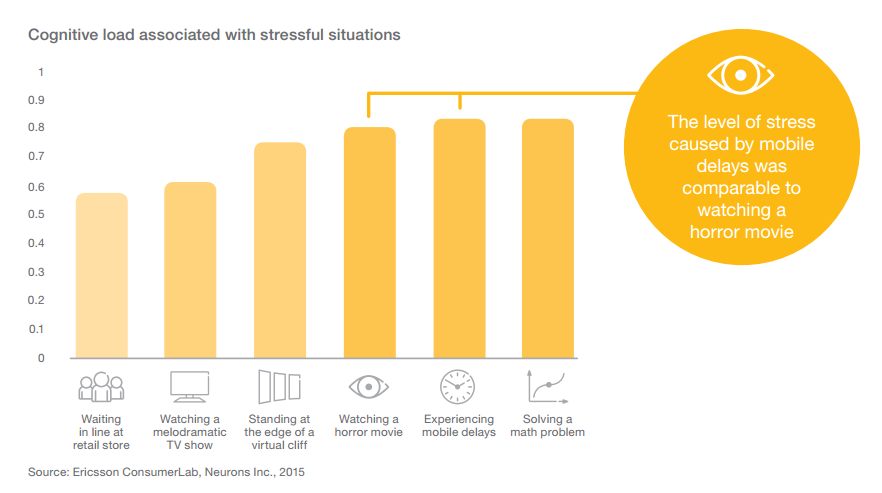
4. Mobile delays make us more stressed than watching a horror movie
In February 2016, Ericsson released an interesting neuroscience study measuring user reactions to web performance hiccups while completing tasks under time constraints. It revealed that experiencing delays in loading web pages and videos was comparable to watching a horror movie.
Source: 1
5. 80% of the Alexa top 100 use adaptive design
mobiForge did a research on web design methodology used by the web’s top brands. The result was that fully 80% of Alexa top 100 use adaptive design including the largest players, such as Google, Facebook, and Twitter.
Source: 1
6. There are over 1.7 billion AMP pages
AMP is Google’s project aimed at significantly lightening websites accessed from mobile devices which we covered many times on mobiForge.
Google’s VP of Search and AMP said in March 2017 that there were 1.7 billion AMP pages available on 860,000 domains. He said that 35 million new AMP pages were added every week!
The speed of AMP’s adoption is impressive, given that according to stats released by the AMP project, in October 2016 there were ca. 600 million AMP pages published on 700,000 domains. Google also noted that there were 8.7k developers working on AMP-focused projects.
The first edition of AMP Conf, which we covered on mobiForge, took place in New York on March 7-8 2017.
7. CTRs on Wired’s AMP pages are 63% higher
The AMP project’s website also covered some interesting case studies showing the effect of AMP on traffic metrics. One of them is focused on Wired which reportedly increased its CTRs by 63% thanks to AMP. At the same time, Wired’s CTRs from search results increased by 25% meaning that users were more likely to click on search results that ensure good performance on mobile.
Source: 1
8. 68% of digital media time now spent on mobile devices
The latest report by ComScore revealed that the amount of digital media time spent using mobile devices reached 68% in the U.S. That leaves only 32% of digital media time for using desktop or laptop computers. The smartphone has now become the primary way of getting online, and, perhaps more importantly, for many users, it is the only way.
Source: 1
9. 35% of online purchases happen on mobile
According to a study by Criteo, 35% of online purchases in Q2 2016 in the USA happened on mobile devices. The company also noted that it was the first time ever that the leading 25% of retailers saw at least 50% of their sales generated by mobile phones.
Source: 1
10. Mobile web is getting more visitors than mobile apps
The conversion rate in apps is higher than in mobile browsers, but it’s the mobile web that is getting more eyeballs today according to the latest Comscore report. This finding underlines the fact that mobile optimization is super important to make sure that the website generates sales regardless of the visitor’s device.
Source: 1
11. Apps deliver 54% of all transactions on mobile
Criteo also analyzed how big the share of mobile apps is in terms of generating online sales. The company found that slightly more transactions happened within apps than through a mobile browser. The same figure for Q2 2015 was 47%.
Source: 1
12. Conversion rate in apps is 1.5x higher than on desktop and 3.5x higher than in a mobile browser
The conversion rate in apps is the highest of all channels analyzed by Criteo according to its report based on the American market.
It looks like customers trust mobile apps the most when it comes to spending money online. However, we shouldn’t forget that a lot of these sales are probably related to in-app purchases available in mobile games, the most popular app category. According to Statista, games have the largest share in Apple App Store (25.04%), followed by business (9.88%), education (8.47%) and entertainment (6.12%).
13. 49% of smartphone users download 0 apps per month
If you need evidence showing that the app boom is over, you may also check out Comscore’s “The 2016 U.S. Mobile App Report”. The study revealed that 49% of mobile users never download new apps, while 32% of users download only 1-3 new apps per month. The average number of apps downloaded per person is 3.5 per month but this is only counting people who download any apps at all.
Another study by Forrester Research showed that 84% of time people spend using their smartphones is spent on just 5 apps they’ve installed from an app store.


Leave a Reply