
Debugging is an essential part of software development. It’s through debugging that we know what’s wrong and what’s right, what works and what doesn’t. Debugging provides the opportunity to assess our code and fix problems before they’re pushed to production.
In the React Native world, debugging may be done in different ways and with different tools, since React Native is composed of different environments (iOS and Android), which means there’s an assortment of problems and a variety of tools needed for debugging.
Thanks to the large number of contributors to the React Native ecosystem, many debugging tools are available. In this brief guide, we’ll explore the most commonly used of them, starting with the Developer Menu.
Debugging is twice as hard as writing the code in the first place. Therefore, if you write the code as cleverly as possible, you are, by definition, not smart enough to debug it. — Brian W. Kernighan
The Developer Menu
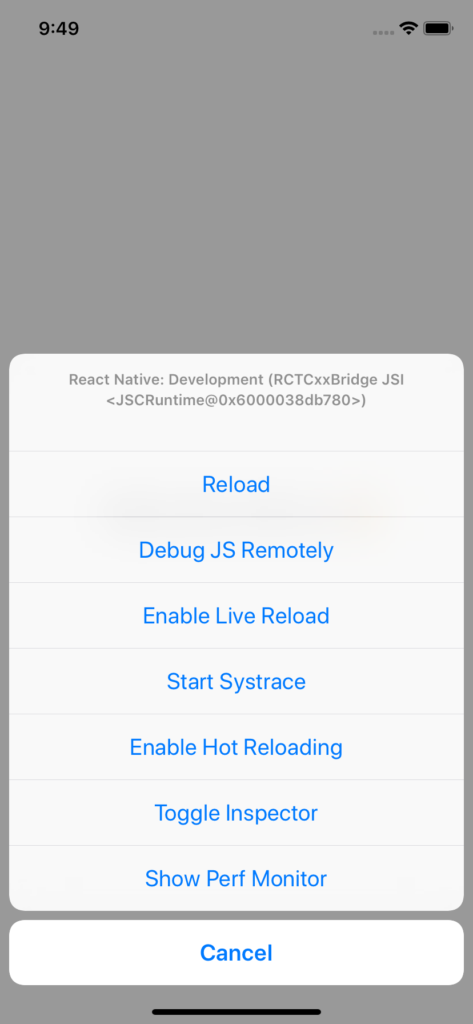
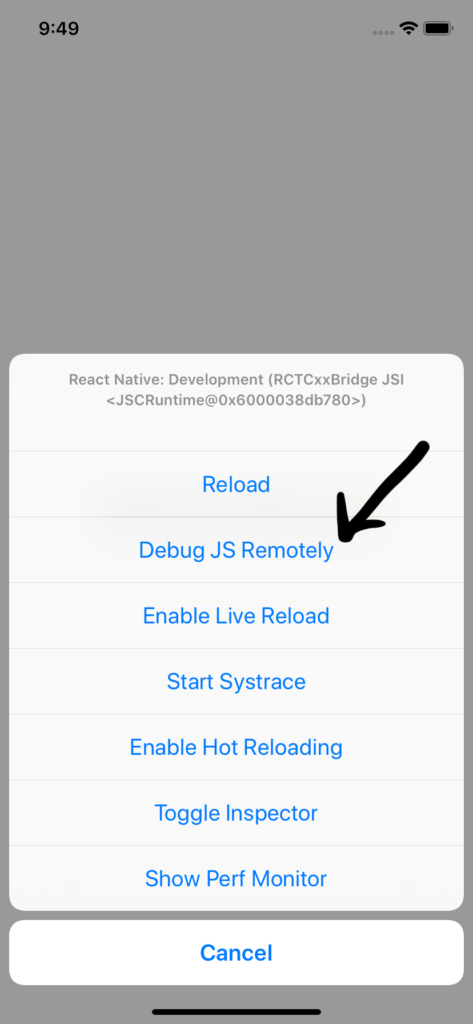
The in-app developer menu is your first gate for debugging React Native, it has many options which we can use to do different things. Let’s break down each option.
- Reload: reloads the app
- Debug JS Remotely: opens a channel to a JavaScript debugger
- Enable Live Reload: makes the app reload automatically on clicking Save
- Enable Hot Reloading: watches for changes accrued in a changed file
- Toggle Inspector: toggles an inspector interface, which allows us to inspect any UI element on the screen and its properties, and presents and interface that has other tabs like networking, which shows us the HTTP calls, and a tab for performance.
YellowBoxes and RedBoxes
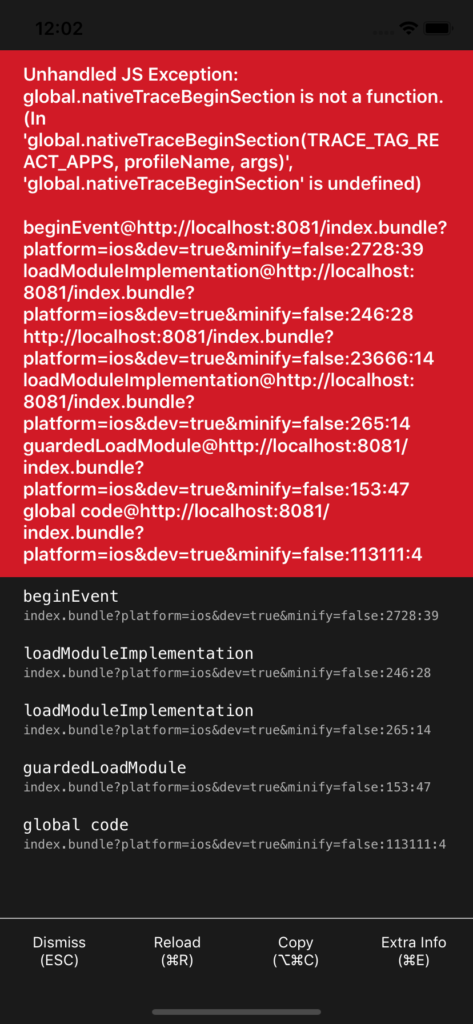
RedBoxes are used to display errors. Every time an app throws an error, it will display a RedBox and the description of the error. You can display it any time by writing console.error. But it doesn’t work in the production, meaning that if an error happens in that environment, the app will crash and stop running.
The RedBox is your friend. One of the helpful things about it is that it displays the error and gives you the suggestions on how to fix it, which you won’t find in the console. For example, I’ll frequently write a style property that’s not supported by React Native, or a property that’s used for a specific element—such as setting backroundImage for the View element. The Redbox will throw an error, but it will also show the list of supported style properties that you can apply to the View.
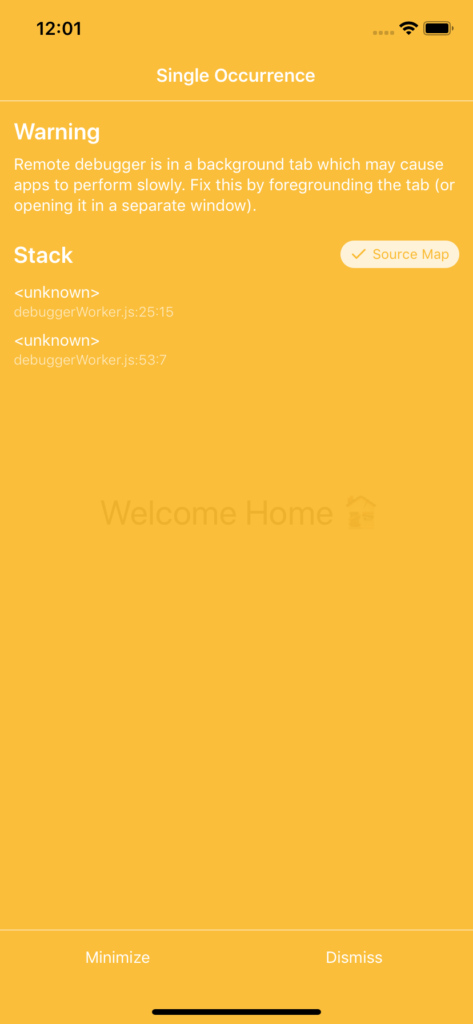
YellowBoxes are used to display warnings. You can disable them by adding line of code shown below inside index.js in the root directory of your app. But that’s not recommended, as YellowBoxes are very useful. They warn you about things like performance issues and deprecated code. You can use the YellowBox element from react-native to display a specific warning.
import {YellowBox} from 'react-native';
YellowBox.ignoreWarnings(['Warning: ...']);
Most YellowBox warnings are related to some bad practice in your code. For example, you might get a warning that you have an eventListener that you aren’t removing when the component unmounts, or that you have deprecated features and dependencies like this:
warning: ViewPagerAndroid has been extracted from react-native core and will be removed in a future release. It can now be installed and imported from '@react-native-community/viewpager' instead of 'react-native'. See https://github.com/react-native-community/react-native-viewpager
Fixing these issues will prevent many bugs and will improve the quality of your code.
You can always learn more about debugging React Native in the official docs.
Chrome’s DevTools
Chrome is possibly the first tool you’d think of for debugging React Native. It’s common to use Chrome’s DevTools to debug web apps, but we can also use them to debug React Native since it’s powered by JavaScript.
To use Chrome’s DevTools with React Native, first make sure you’re connected to the same Wi-Fi, then press command + R if you’re using macOS, or Ctrl + M on Windows/Linux. When the developer menu appears, choose Debug Js Remotely. This will open the default JS debugger.
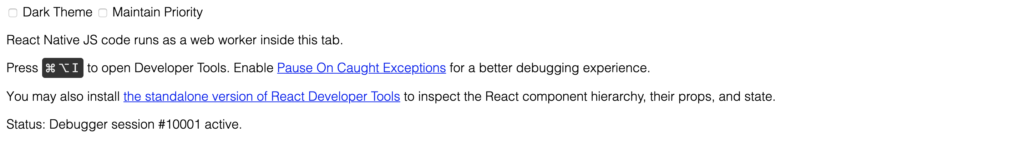
Then check this address http://localhost:8081/debugger-ui/ in Chrome. You should see this page:
You may have to do some troubleshooting on Android.
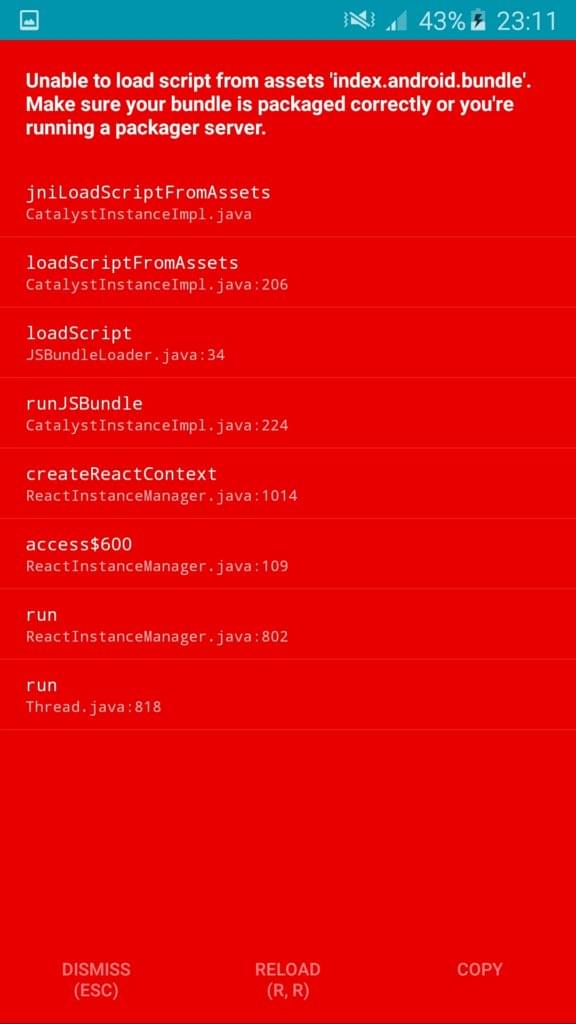
To solve this problem, make sure your your machine and the device are connected on the same Wi-Fi, and then add android:usesCleartextTraffic="true" to android/app/src/main/AndroidManifest.xml. If this doesn’t work for you, check out these links for other solutions:
After you have successfully connected to Chrome, you can simply toggle the Chrome inspector.
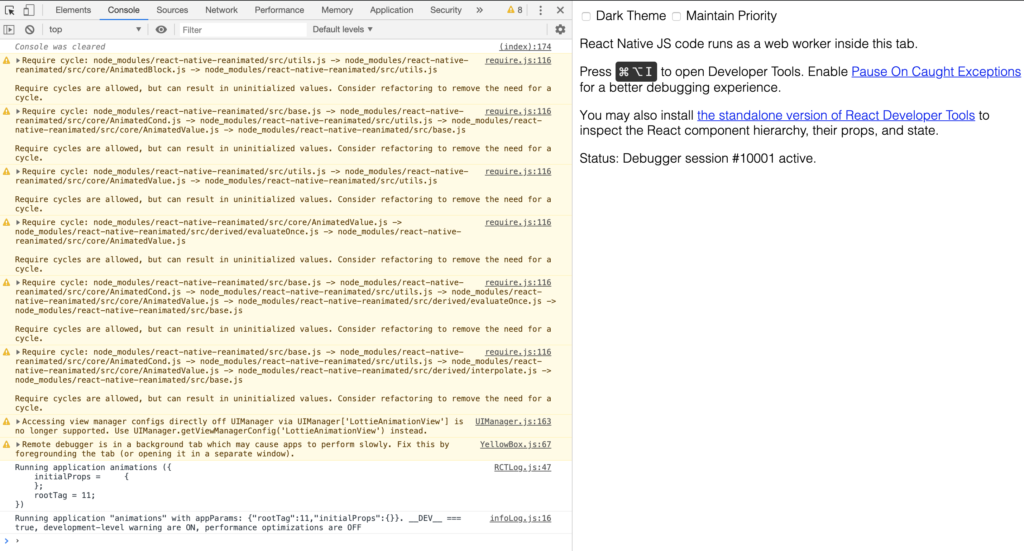
Then take a look at the logs of your React Native app. Also have a look through the other features offered by Chrome’s DevTools, and use them with React Native as you do with any Web app.
One of the limitations of using Chrome’s DevTools with React Native is that you can’t debug the styles and edit the style properties as you usually do when you debug web apps. It’s also limited in comparison with React’s devtools when inspecting React’s component hierarchy.
React Developer Tools
To debug React Native using React’s Developer Tools, you need to use the desktop app. You can install it globally or locally in your project by just running this following command:
yarn add react-devtools
Or npm:
npm install react-devtools --save
Then start the app by running yarn react-devtools, which will launch the app.
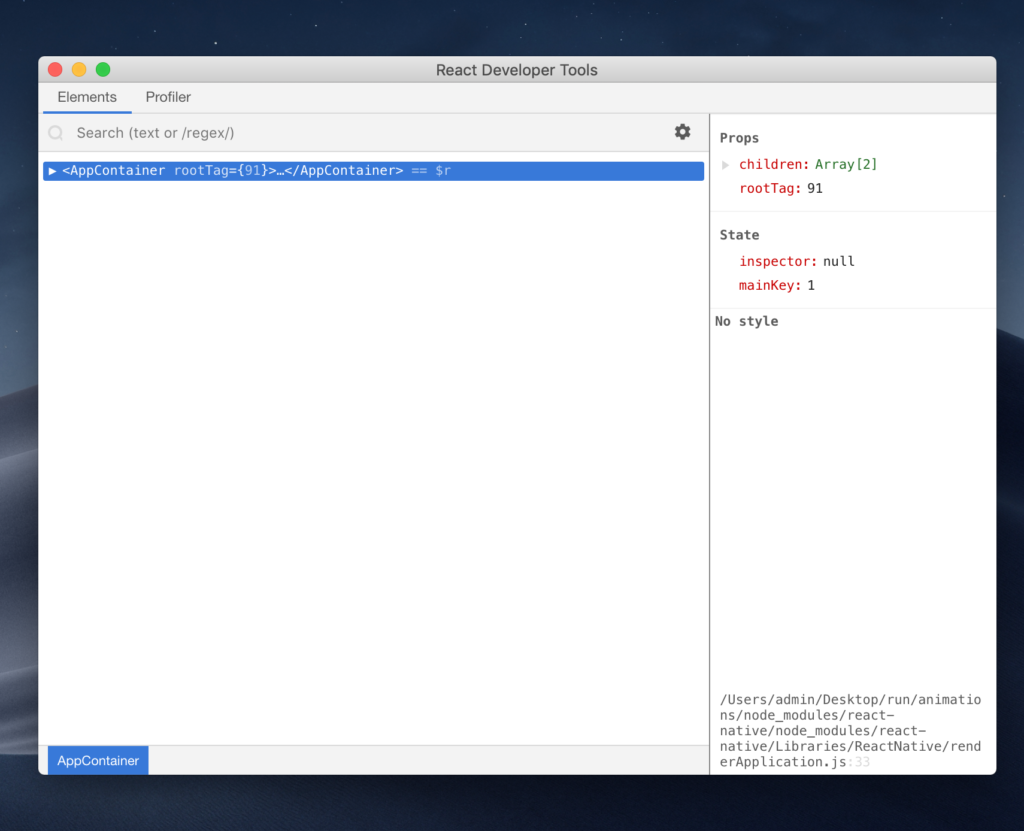
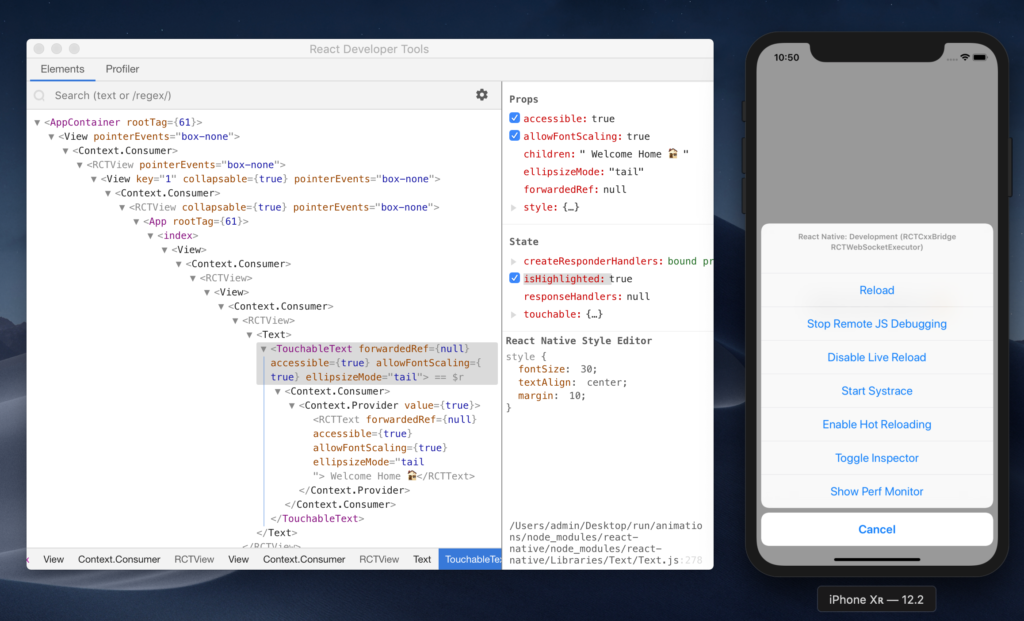
React’s Developer Tools may be the best tool for debugging React Native for these two reasons:
- It allows for debugging React components.
- It makes it possible to debug styles in React Native (my favorite feature of these developer tools!). The new version comes with this feature that also works with inspector in the developer menu. Previously, it was a problem to write styles and have to wait for the app to reload to see the changes. Now we can debug and implement style properties and see the effect of the change instantly without reloading the app.
You can learn more about using React’s Developer Tools app here.
React Native Debugger
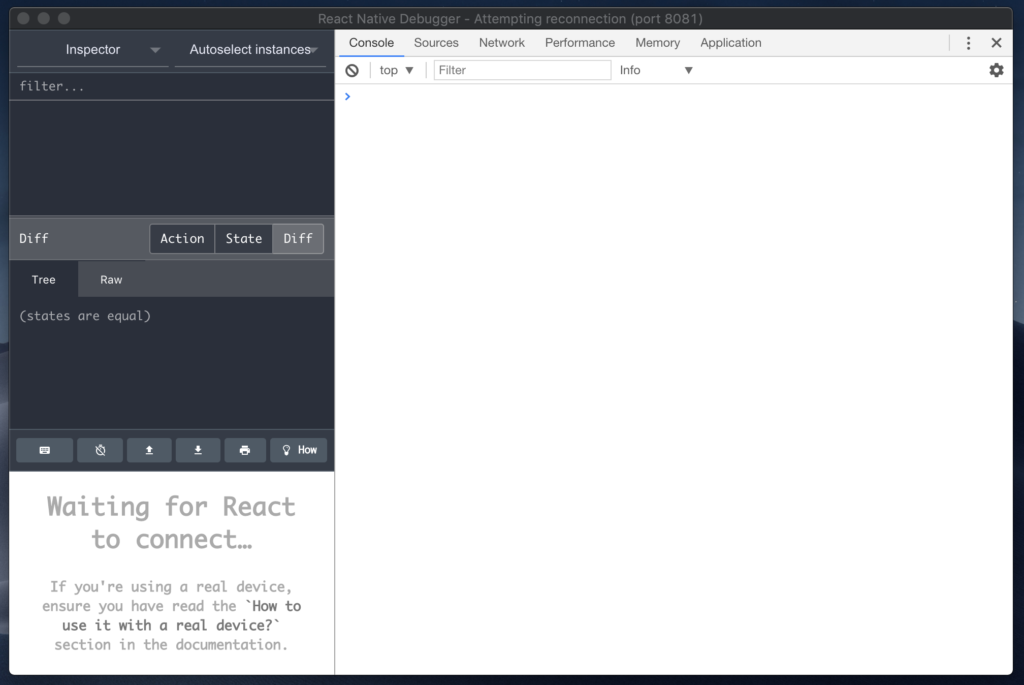
If you’re using Redux in your React Native app, React Native Debugger is probably the right debugger for you. It’s a standalone desktop app that works on macOS, Windows, and Linux. It integrates both Redux’s DevTools and React’s Developer Tools in one app so you don’t have to work with two separate apps for debugging.
React Native Debugger is my favorite debugger and the one I usually use in my work with React Native. It has an interface for Redux’s DevTools where you can see the Redux logs and the actions, and an interface for React’s Developer Tools where you can inspect and debug React elements. You can find the installation instructions here. You can connect with this debugger in the same way you open Chrome’s inspector.
Using React Native Debugger over Chrome’s DevTools has some advantages. For example, you can toggle the inspector from the Dev Menu to inspect React Native elements and edit styles, which isn’t available in Chrome’s DevTools.
React Native CLI
You can use the React Native CLI to do some debugging as well. You can use it for showing the logs of the app. Hitting react-native log-android will show you the logs of db logcat on Android, and to view the logs in iOS you can run react-native log-ios, and with console.log you can dispatch logs to the terminal:
console.log("some error🛑")
You should then see the logs in the terminal.

You can use the React Native CLI to get some relevant info about the libraries and the dependencies you’re using in your app, by running react-native info on the terminal. It shows us some useful info about the tools you’re using. For instance, here’s an example of an output when you run react-native info:
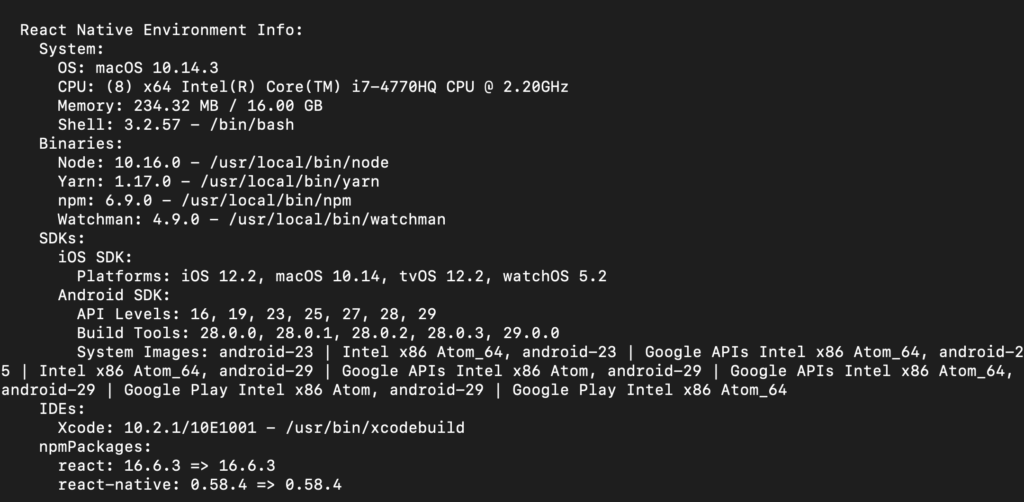
You can use this info to fix some bugs caused by version mismatches of a tool you’re using in your project, so it’s always good to check the environment info using this command.
Summary
There are lots of tools for debugging React Native in addition to the ones we’ve looked at here. It really depends on the specific needs of your project. I mostly use React Native Debugger Desktop because I often work with Redux, and it combines an array of tools in one app which is great and a time saving.
Please hit me on Twitter if you’d like to talk more about tools to debug React Native and about React Native in general. I’d love to hear from you!
Frequently Asked Questions (FAQs) about Debugging in React Native
What are the best tools for debugging in React Native?
There are several tools available for debugging in React Native. Some of the most popular ones include React Native Debugger, Reactotron, and Flipper. React Native Debugger is a standalone app that combines React DevTools and Redux DevTools. It allows you to inspect the React component hierarchy, Redux store, and dispatch actions. Reactotron, on the other hand, is a desktop application that allows you to inspect Redux or MobX-State-Tree application state. Flipper is a platform for debugging mobile apps. It’s extensible and has a marketplace to install plugins that can help in debugging various parts of your app.
How can I debug network requests in React Native?
Network requests can be debugged in React Native using tools like Flipper or Reactotron. These tools allow you to view all network requests made by your app, inspect their details, and even modify their responses. You can also use the built-in Network inspector in React Native Debugger.
How can I debug layout issues in React Native?
Layout issues in React Native can be debugged using the Inspector tool in React Native Debugger. This tool allows you to select any component on the screen and inspect its layout, styles, and props. You can also use the Layout Inspector in Flipper, which provides a similar functionality.
How can I debug performance issues in React Native?
Performance issues in React Native can be debugged using the Performance Monitor built into React Native. This tool provides real-time stats about your app’s performance, such as FPS (frames per second), RAM usage, and CPU usage. You can also use the Profiler in React DevTools to measure how often a React component renders and what is causing it to render.
How can I debug Redux state in React Native?
Redux state in React Native can be debugged using Redux DevTools. This tool allows you to inspect every state and action payload, and it lets you go back in time by “cancelling” actions. You can use Redux DevTools as a standalone app, or you can integrate it into React Native Debugger or Reactotron.
How can I debug native code in React Native?
Native code in React Native can be debugged using platform-specific tools. For Android, you can use Android Studio’s built-in debugger. For iOS, you can use Xcode’s built-in debugger. These tools allow you to set breakpoints, step through code, and inspect variables.
How can I debug memory leaks in React Native?
Memory leaks in React Native can be debugged using the Memory profiler in Flipper or React Native Debugger. These tools provide information about the memory usage of your app, and they can help you identify components that are not being properly cleaned up.
How can I debug asynchronous code in React Native?
Asynchronous code in React Native can be debugged using async storage. This allows you to see the sequence of actions and state changes in your app, which can help you identify where things are going wrong. You can also use tools like Reactotron, which provide features for tracking async storage.
How can I debug animations in React Native?
Animations in React Native can be debugged using the Animation Inspector in React Native Debugger. This tool allows you to see values of animated properties as they change over time. You can also use the Performance Monitor to check the FPS of your animations.
How can I debug crashes in React Native?
Crashes in React Native can be debugged using crash reporting tools like Sentry or Crashlytics. These tools collect crash reports from your users in real-time, allowing you to see exactly what happened leading up to a crash. They provide detailed stack traces, device information, and user actions.
 Said Hayani
Said is an NYC-based front-end developer, technical writer and instructor.