
Hiring? Flexiple helps you build your dream team of developers and designers.
Xcode Build Optimization: A Definitive Guide

Saravanan V
Last updated on
If you are looking for ways to reduce your Xcode project’s build time i.e. improve build performance, then you are at the right place. I chose this topic since I haven’t come across any blog or article that has an exhaustive list of ways to fasten up an Xcode build.

Reducing build times is super helpful for developers especially when you are working on decades-old legacy codebases with tons of dependencies. Hence, in this article, I will try to list down all possible ways in which we can tweak our iOS project to elevate the performance of Xcode build.
Table of Contents
A quick note on the taxonomy:
- Action Points – Outlines specific actions you can perform in Xcode
- Real-time Effect – I have chosen this awesome open-source project and have run the suggested optimization(s) against it. This section shares the results of these experiments.
Without further ado, let’s jump straight into the options.

Prerequisite – Show Build Time
Foremost, we need to know how much time Xcode takes to build our project. By default, Xcode doesn’t display the build time, so we’ll have to enable it.
Action Points
1. Simply copy-paste and run this command in the terminal:
‘defaults write com.apple.dt.Xcode ShowBuildOperationDuration -bool YES’2. Now after you build your project, Xcode’s bar should display the build time like this:

Note 1: If Xcode doesn’t display it for some reason, then try restarting it
Note 2: In order to have the correct build time displayed, please make sure to deep clean your project. The derived data including the Build folder (Command + Shift + K) should be cleaned before building the project.
Now that we’re done with the prerequisite, let’s get into actually tweaking the settings to improve the performance of build generation.
Build System
Xcode 9 introduced a new build system (I think it is called XCBuild internally), which was only in its preview version. But in Xcode 10, it is being used by default, and is written from scratch in Swift. The major goal of this new build system is to reduce the overall build time.
Action Points
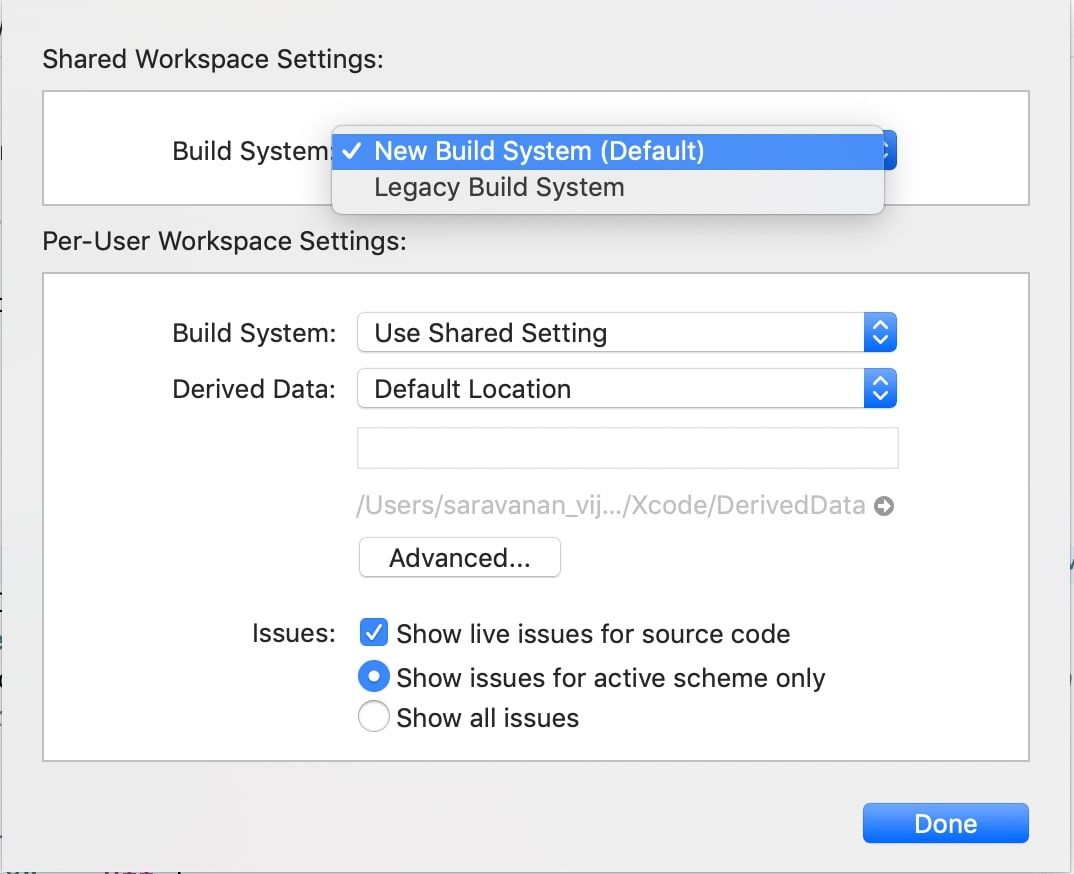
To use the new build system you can enable it in the File menu and select ‘Workspace Settings’ (or ‘Project Settings’ if you aren’t using a Workspace).
In order to see its actual implication, you should try building the project using both (legacy/ new) build systems and contrast & compare build times. Although this would not affect sample projects heavily, it will definitely have a drastic impact on a heavy-duty codebase. Projects with legacy codebases and lots of dependencies would a great target.
Real-time Effect
Now, let’s take the open-source project we spoke about and build it using both the build systems.
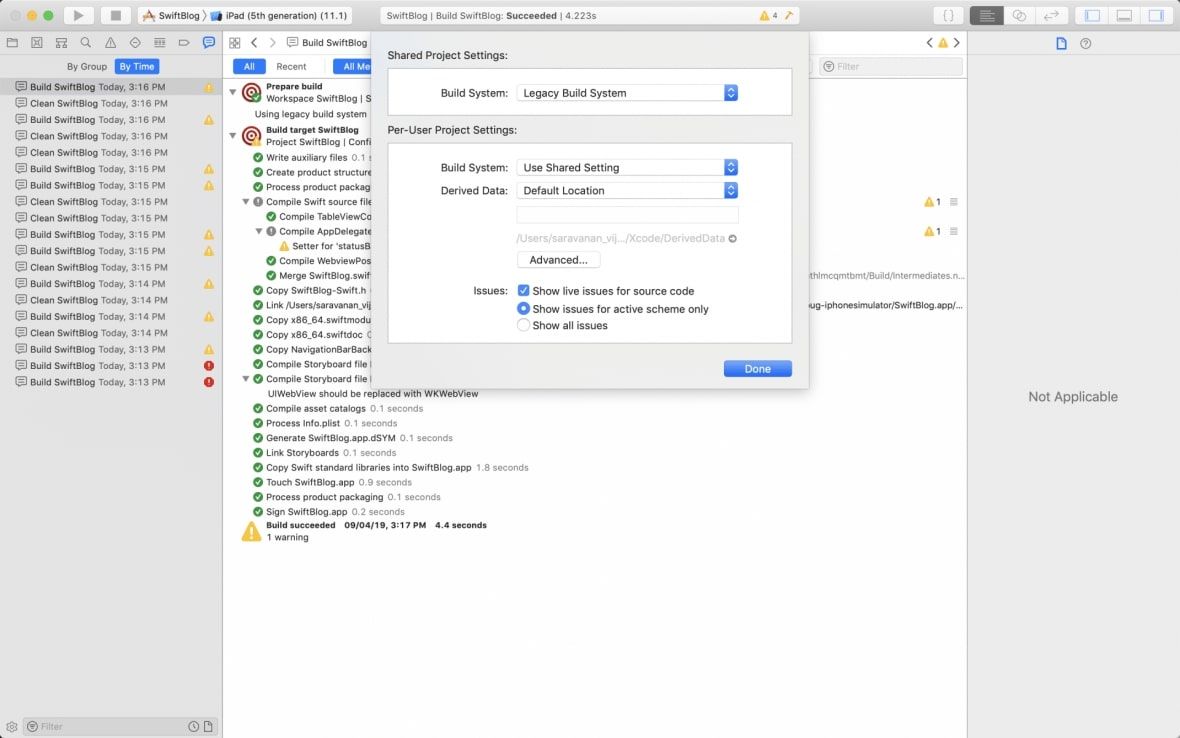
Legacy Build System
New Build System
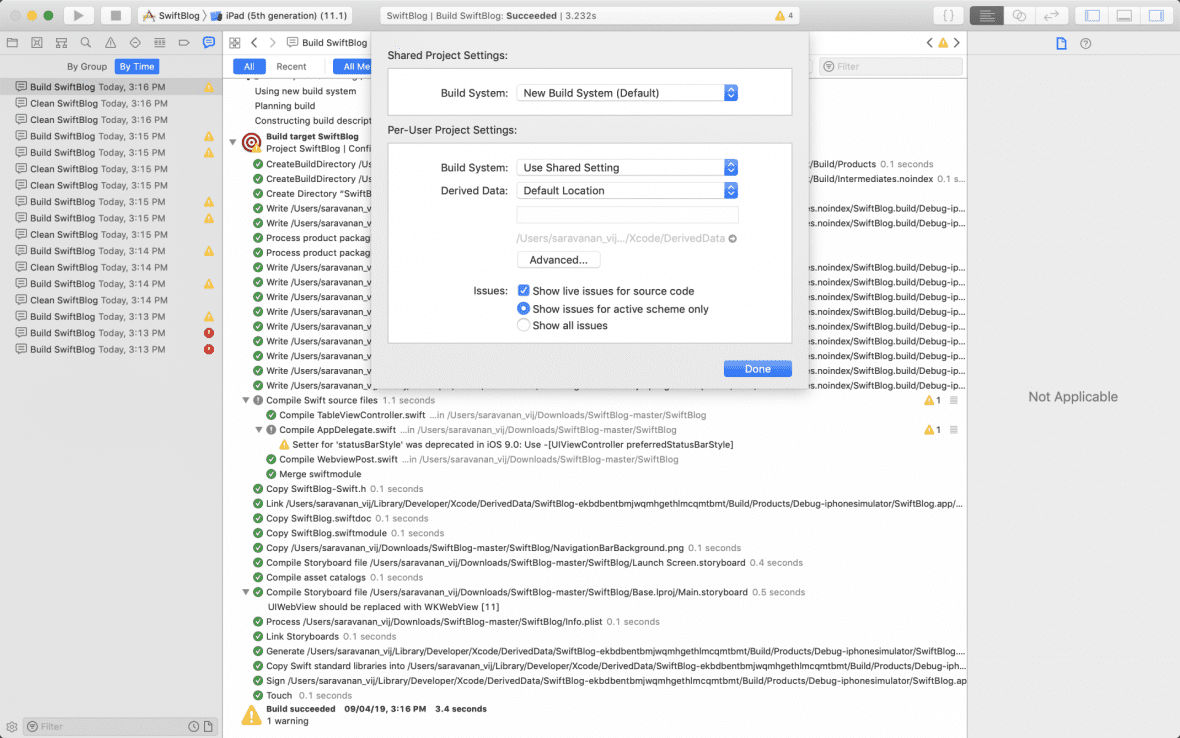
Do you see the difference? 0.991sec! (4.223 sec for legacy & 3.232 sec for the new system). This project doesn’t even have any dependencies and it still shows a difference of ~1 sec, which is huge!
So, this is more like tweaking the Xcode/tool’s setting itself. Next up, we’ll see what project settings can be tweaked to reduce build time.
Architecture impact
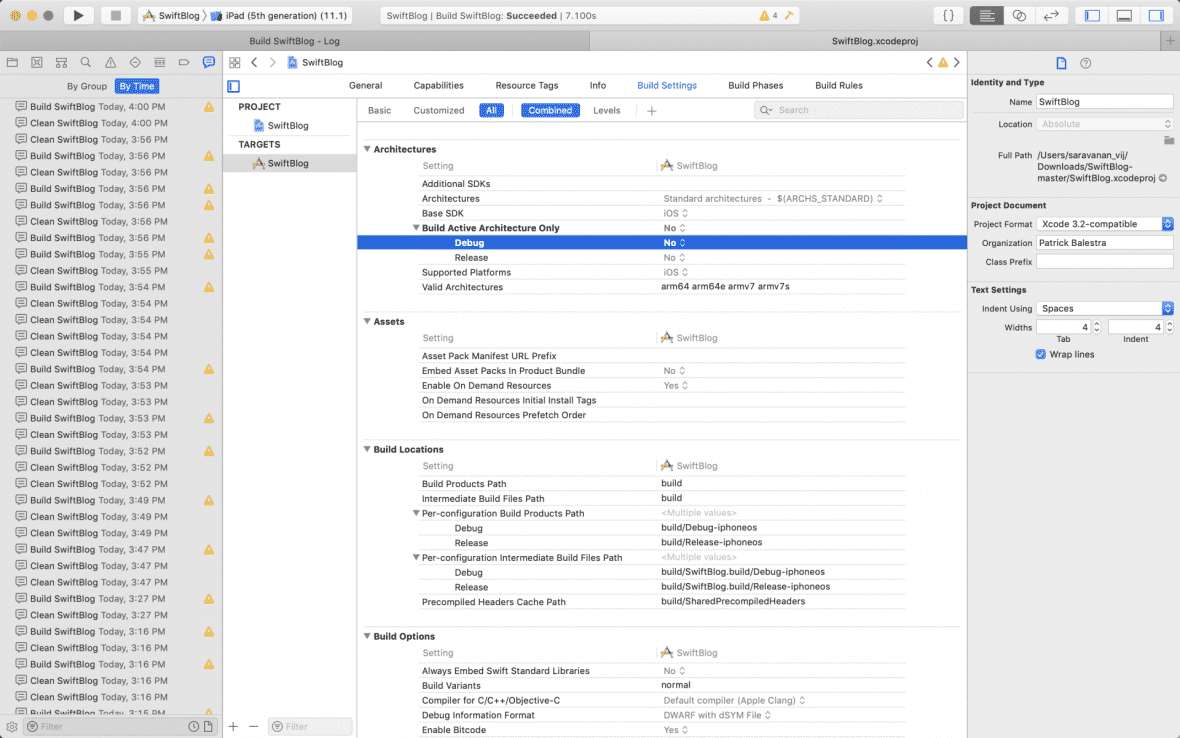
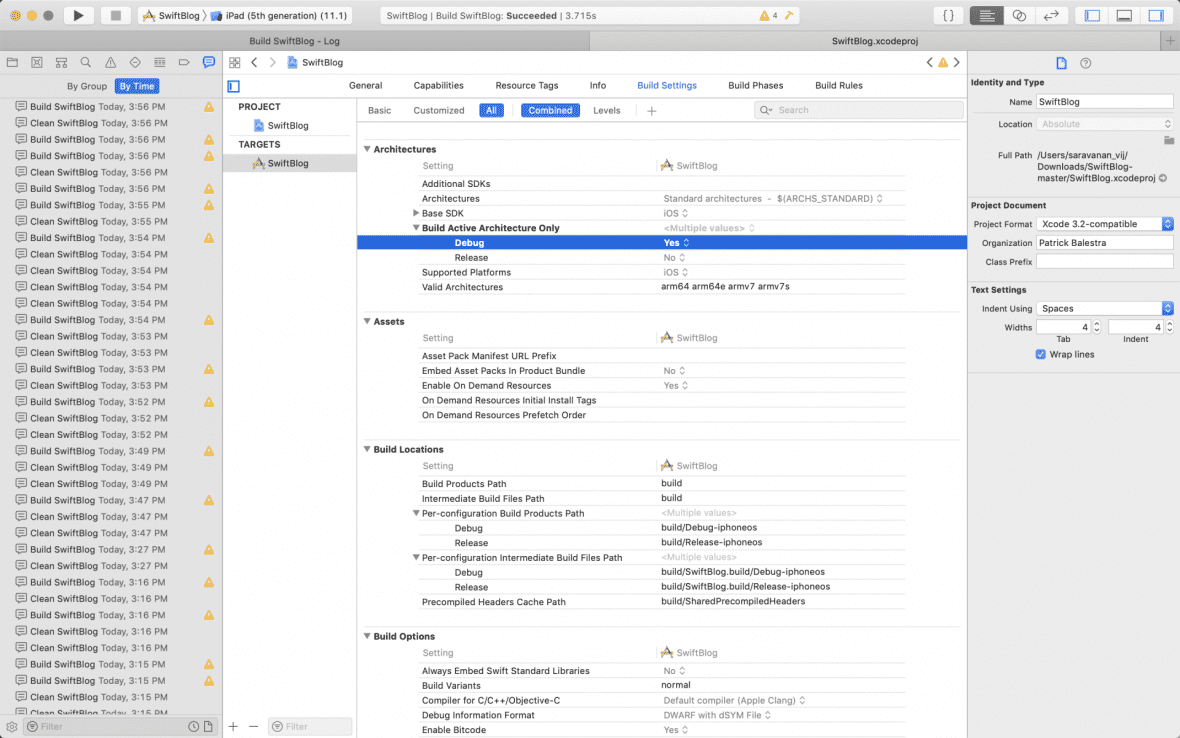
We care about build times mostly during development, which essentially takes most of our time. When you execute a project’s build in debug mode, it is always better to have it built only for the active architecture. This is the default option in Xcode, although it is better to check it up, just in case.
Devices & Simulators have different architecture, but generally, during development, we want Xcode to run the build either on device or simulator only. So, by setting ‘Build Active Architecture Only’ to ‘Yes’, we ask the compiler to generate the binary only for one architecture. This will have a drastic impact depending upon the changes in your project’s modules & dependencies.
Action Points
Go to ‘Build Active Architecture Only’ in your project’s build settings and have the ‘Debug’ set to ‘Yes’ and ‘Release’ to ‘No’.

Real-time Effect
Let’s try applying this configuration to the same open-source project and see how it works.
All Architectures
Active Architecture Only
Notice the difference of 3.385 sec! (7.100 sec for “All Architectures” & 3.715 sec for “Active Architecture Only”)
Note: We built the project with the legacy build system’. Try building with the new build system and you’ll see a huge difference again.
Compilation Mode
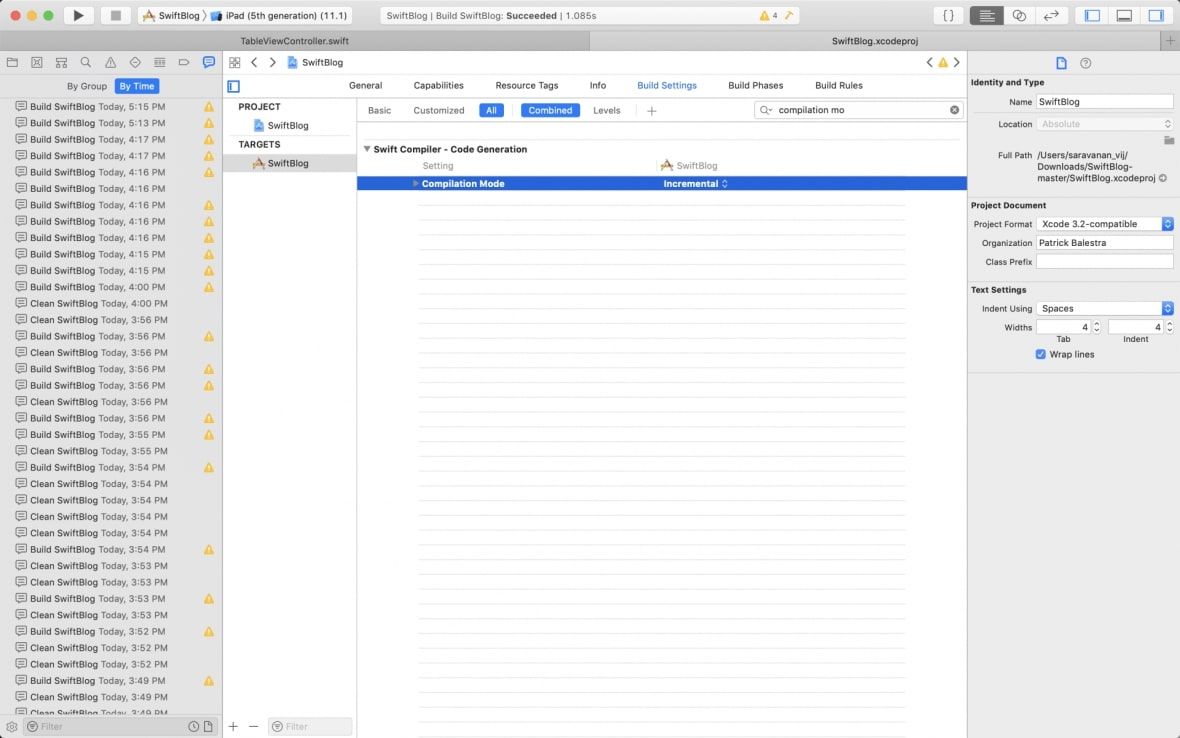
The ‘Compilation Mode’ tells the compiler whether to build all files in the project or only the modified files. ‘Incremental’ says to compile only the files that are modified and ‘Whole module’ denotes to build all files in the project irrespective of the changes made.
Action Points
1. Goto ‘Compilation Mode’ in build settings. By default, Xcode 10 should have set it to ‘Incremental’ for Debug and ‘Whole Module’ for Release.

2. If the build settings in your project looks like above, then we’re good. Else, you need to make sure that this setting is in place.
Real-time Effect
Let’s try applying this configuration to the same open-source project and see how it works.
Note: You should follow these steps to see the optimization:
- Build the project once
- Make some changes
- Build it again → This is where this ‘Compilation Mode’ comes into play aka building after making changes
Incremental
Whole Module

You might be shocked to see the inverse effect here. Yes, in such a small project, it is better to have ‘Whole Module’ option selected (although it doesn’t make any huge difference). Since the compiler will omit the whole process of detecting the changed files internally, it would eventually save some time. But in projects with lots of dependencies, ‘Incremental’ is the optimal choice.
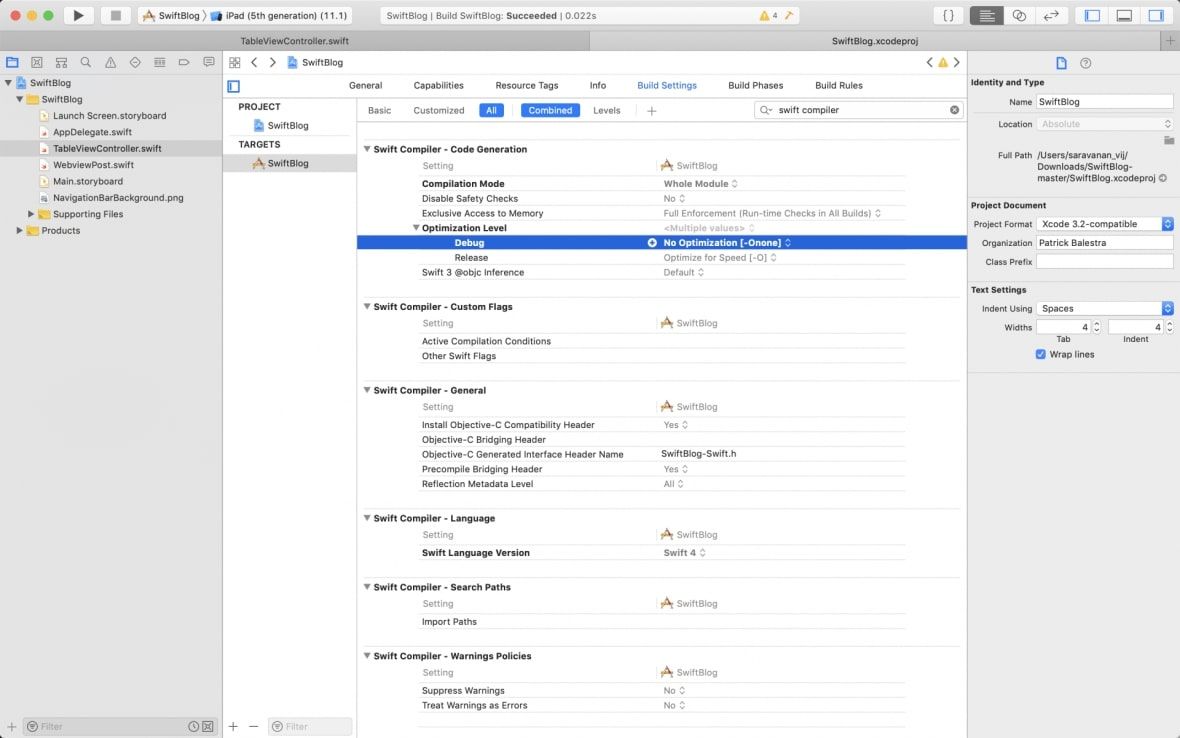
Optimization Level
The ‘Optimization Level’ tells the compiler to optimize the build to a certain level. Generally, debug builds are set with ‘No Optimization’ since it allows the developers to debug through the values contained by let/ var. This is very much required during the debugging phase.
Action Points
1. Goto ‘Optimization Level’ in build settings and verify the set values:

2. If you’re not doing a great deal of debugging, it is better to set this to ‘Optimize for Speed’. This will eventually reduce the build time as the compiler will omit the steps of attaching values to the debugger thread.
Note: There is another setting called ‘Optimize for Size’, which generally refers to the overall size of the machine code generation and not specifically to the app size. Given, we are focused on reducing the ‘build time’ in this article, we will skip this for now.
Real-time Effect
Let’s try applying this configuration to the our open-source project.
Note: You should follow the same steps mentioned in ‘Compilation Mode’ to see the effect.
No Optimization
Optimize for Speed
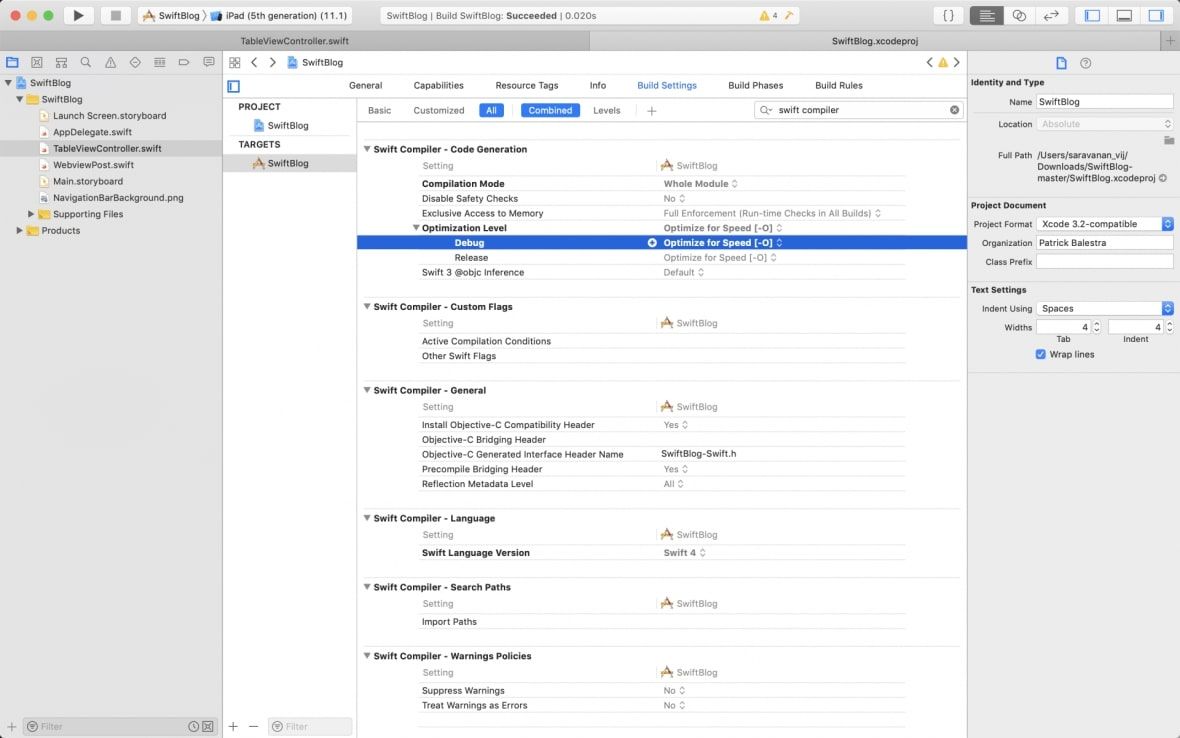
This displays a minor 0.2s difference, but it will have a considerable impact on a large project.
Dependency Management
There are 2 major dependency managers for iOS: Carthage & Cocoapods.
Both have their own pros & cons. There is a lot of hot debate about which one suits what kind of project but we won’t delve into that. Let’s see, though, how it relates to the build process.
Generally, in most projects, once any dependency lib/ module/ framework is integrated, we seldom want to make changes to its source code. Even if we do, it is always a best practice to have those changes into a separate repo/ module/ framework and then integrate that particular module/ framework into the source project. The underlying idea is to decouple the module/ framework as much as possible embracing modularity.
Static/ dynamic frameworks are very helpful when integrating any 3rd party libraries in our iOS project since the frameworks once generated aren’t re-compiled in the source project. This eventually saves a lot of time and hence, is one of the major reasons for people choosing Carthage over Cocoapods.
When you have a project with dependencies managed by Cocoapods, every time the project is compiled, all sources of the dependencies are compiled. In case of Carthage, though, the dependency library’s source is compiled only once when you’re adding that dependency. It generates a framework and links it against the source project which is not compiled again during the build generation process.
We’ll see how we can make the compiler execute builds in parallel, which is tightly linked with the dependencies defined in the project.
1. Build Machine Cores
Prerequisite – To find the number of cores of your mac
Action Points
1. Run this command from the terminal:
‘sysctl -n hw.ncpu’2. It should output an integer representing the number of cores your machine has:
4 (This is from my Macbook)Bigger build machines like iMac with 12-cores run the same build 3x faster than mine. So, basically, the number of cores in your machine plays a major role i.e. it is directly proportional to the build execution time.
By default, Xcode typically uses the same number of threads as the number of cores in the machine’s CPU. However, you can dramatically reduce build times – in some instances by a full 30% – by increasing the thread count beyond the default. This takes advantage of processors’ ability to multi-thread or simulate additional cores. Keep in mind, though, that you may need to experiment to determine if there are diminishing returns for parallelized builds with your codebase, and then adjust the thread count accordingly.
Modify thread counts
Let us try modifying the number of threads.
Action Points
Run this command from your terminal:
‘defaults write com.apple.Xcode PBXNumberOfParallelBuildSubtasks 8’Up next is a much simpler way of enabling parallel build execution. This is done from Xcode UI itself, which does this optimization automatically.
2. Parallel Build Execution
We’ll look into how the Parallel build execution in Xcode can be enabled.
Action Points
Navigate to ‘Edit Scheme → Build’ and check the ‘Parallel Build’ and ‘Find Implicit Dependencies’ as below:

Build Hypothesis
Xcode compiler takes the project source and forms a tree-like structure to define the dependencies of modules. It then goes compiling with a bottom-up approach i.e. compiling the modules with least dependencies first.
In general, the Xcode project would have multiple dependencies on frameworks and other targets. For example, when a project has ‘Target Dependencies’ added to it, the compiler first makes sure that the linked target framework/module is compiled as the first step. Similarly, when the test target is executed, the compiler first makes sure that the app target is first executed. So dependencies play a major role in enabling the compiler to perform parallel build execution in the best possible way. Here’s what we can do:
- List out all the dependencies in the order of execution
- List out all the targets in the project in the order of execution
- Keep lesser dependencies
- De-couple or modularise the codebase to have independent modules
Although dependencies are internally identified by the compiler anyway, it is always better to have them placed in their execution order. This eventually helps the compiler to save time in rearranging dependencies internally during the build process.
When done properly, this should give you a boost of 2x to 3x times build performance, again depending upon your project’s complexity.
Real-time Effect
For smaller hobby projects with no or fewer dependencies, the effect is inverse i.e. parallel builds will actually increase build time. We will observe this in the open-source project we have chosen (similar to the results with “Optimize for Speed”)
However, for real projects, typically with lots of dependencies, it makes sense to have the ‘Parallel Build’ in place.
Another important trait with respect to ordering of dependencies is linking frameworks which we will see next.
Linking Frameworks
‘Link Frameworks Automatically’ typically means that any framework added to the project should be linked automatically & considered by the compiler during the build process.
Action Points
Xcode has ‘Link Frameworks Automatically’ set to ‘Yes’, by default.

However, Apple doesn’t guarantee on this aspect and expects developers to link any external frameworks manually into ‘Build Phases → Link Binary With Libraries’ or ‘Target Dependencies’. Although, we don’t have to do this step for implicit dependencies like ‘UIKit’, ‘Foundation’ frameworks which come from iOS SDK itself.
So, the overall point here is to not rely on ‘Link Frameworks Automatically’ for external frameworks. It is best to have the dependencies linked up manually in the Build Phases.
Identify Lazy Code
Xcode allows us to identify blocks of code that are causing huge lags in compilation time. You can specify a time limit for executing a block of code and let Xcode throw a warning for the code that exceeds the specified time limit.
Action Points
1. Navigate to ‘Other Swift Flag’ in the Build Settings and add these flags:
‘-warn-long-function-bodies=200’‘-warn-long-expression-type-checking=200’The integer value ‘200’ represents the milliseconds limit. So, after the build has been executed, Xcode will throw warnings for any function or expression that takes more than 200ms to get executed.
2. After adding these flags, whenever you build the project, Xcode should display warnings like this:

This is very helpful when you want to identify the functions or expressions that consume more time than expected.
dSYM Impact
dSYM files are helpful during de-symbolication process of crash report files. The compiler takes time to produce the dSYM file. It makes sense to have it enabled only when Xcode debugger is not attached. So, it is better to have it disabled when we are running on the simulator.
Action Points
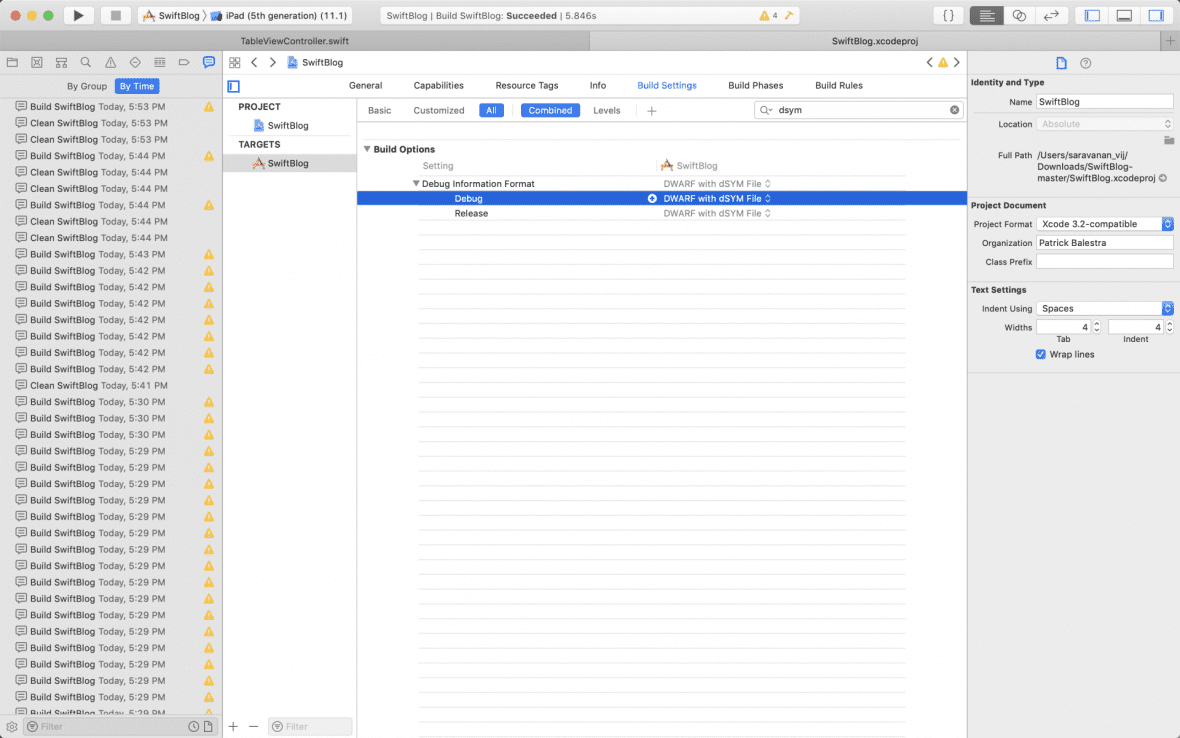
1. Go to ‘Build Options’ in Xcode Build settings
2. Under ‘Debug Information Format’, set the value to ‘DWARF’ for debug scheme and ‘DWARF with dSYM File’ for release scheme:

This setting tells the compiler to omit the process of creating the dSYM file during the debug mode. This will eventually save the build time to a certain extent.
Real-time Effect
Let’s apply this configuration to our open-source project.
Without dSYM

With dSYM
As you can see, it has a difference of 0.6s.
Objective-C/ Swift Interoperability
With the advent of Swift, parts of legacy code bases got migrated to the latest language while some parts continued to be in Objective-C. This eventually lead developers to deal with interoperability in some way or the other.
For interoperability, we have to deal with 2 types of headers:
- Bridging Header – Contains all Objective-C interfaces that should be exposed to Swift.
- Generated Header – Contains all Swift interfaces that should be exposed to Objective-C.
These headers define the dependencies of files written in both languages. Interoperability between these 2 languages’ files happens via the bridging/generated header files. Changes to the header files drastically affects build time. For example, a small change in the Swift interface file enables the compiler to re-compile all the referenced Obj-C files and vice-a-versa.
In conclusion, it is always better to have only the needed interfaces exposed b/w both the languages’ files. Avoid adding/importing the unnecessary files by adding the access modifiers: private/protected.
Reduce UITests execution time
This might sound a bit weird as it doesn’t make sense technically, but it really does.
While running UI Test cases, try tweaking the simulator’s physical & pixel accurate window sizes to as minimum as possible. You will then see some improvements over UITest case execution time.
This happens because when Xcode runs UI test cases, it typically installs & runs the actual app on the simulator to execute any given UI test case. This literally means that it is nothing less than a real user using the app. So, as with a real user using the app, the system core/ resources does/ do get used up while running UI test cases.
Hence, it is always recommended to have the simulator settings to its minimum to have less usage of system resources. This will eventually fasten up test case execution and lead to less execution time overall.
Conclusion
We saw a number of options to tweak in order to improve Xcode build performance. Xcode does provide us with multiple combinations of configurable options but it is up to us to find out what amalgamation works and suits best for a specific project. This, however, can be discovered only by testing out all the options trying to reach a suitable combination.
Certainly, you as a developer would have gone through most of the options already. But if you did find and learn something new and useful from this article, please share it across in your network and let them also rejoice with increased productivity!

