Early in our mobile optimization efforts, each fix meant big leaps in performance improvement. Today, our apps are optimized so much that our time is best spent preventing tiny regressions that, if shipped, could cause our progress to backslide. At Facebook’s scale, that means checking thousands of commits per day to find regressions as tiny as 1 percent. Previous methods worked well for spotting large performance changes, but to refine the accuracy, we had to build a new system, called MobileLab, in which our tests and environment could be substantially more deterministic.
Now in production, MobileLab has already prevented thousands of regressions from shipping, thanks to its ability to detect very small changes in performance (as small as 1 percent for many of our metrics). Compared with our previous standard, MobileLab improves confidence intervals by 7x, while reducing false positives by 75 percent.
Establishing a validation framework
As we set out to build MobileLab, we had to first build a validation framework that would enable quick iteration and allow us to easily see when our tests were successful. MobileLab determines whether a performance metric has changed from a known good build (control) to an unknown new build (treatment). We elected to tolerate a 5 percent false positive rate, as is common in many statistical analyses.
Our validation framework runs many experiments and reports summary statistics across these repeated experiments. As input, we supply A/A experiments, for which we know there should be no reported difference, as well as pairs of builds with a regression of a known size. We use these summary statistics to understand the variability of our metrics and validate the statistical assumptions of our hypothesis test.
Here are some examples of outputs of our validation framework:
- Observed false positive rate: Based on the construction of our hypothesis test, we know to expect a 5 percent false positive rate if we run many A/A experiments. We use a t-test in MobileLab, which assumes that our trials from each app are independent and identically distributed (IID). If this assumption is violated for some reason, then we may see dramatically different false positive rates.
- Variance of control and treatment metrics: The framework would report the observed variance of our metrics so we could monitor our progress toward a 10x reduction.
- Average metric value by trial number across experiments: If the data is indeed IID, then there should be no correlation between trial number and the observed value.
With our framework in place, we were ready to try out our ideas — and were surprised to find that our simple experiment violated some of the statistical assumptions we made. The figure below shows a step change in performance, which means that our trials were not, in fact, IID as we had assumed. Clearly, we had further work to do.
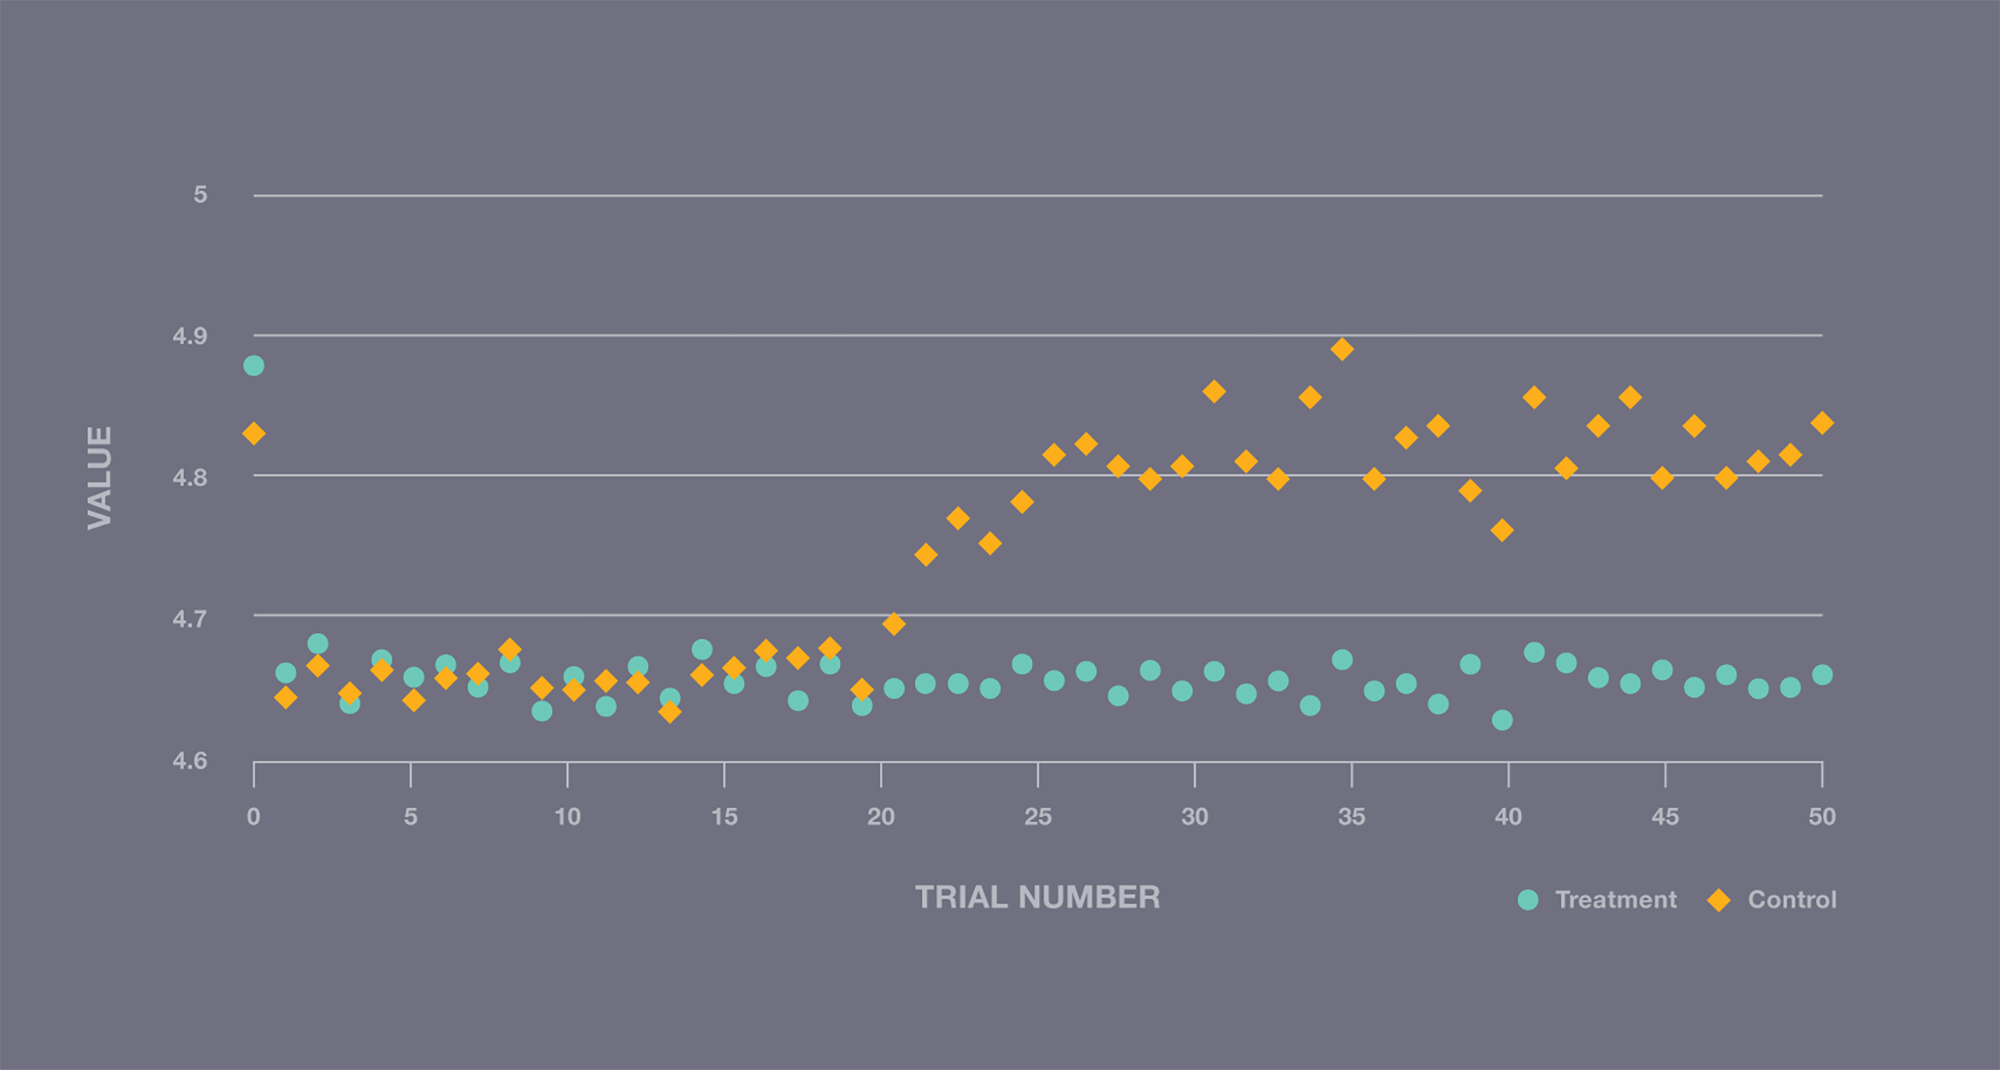
A/A experiment illustrating a step change in performance during execution, violating IID assumptions.
Eliminating variance
To better understand what was happening, we took several steps to improve consistency and understand the trial-to-trial differences we were seeing.
Consistent device performance
We began by using Profilo, our tracing tool, to understand trial-to-trial differences in our system. Every trace our system produced was so distinct from the others that we couldn’t make progress. We needed to start simple and work our way up to a complicated application such as Facebook for Android. We developed a central processing unit (CPU) benchmark that allowed us to analyze the behavior of our platform and device separately from the behavior of workloads.
Using the benchmark, we discovered the performance of the devices was extremely variable.
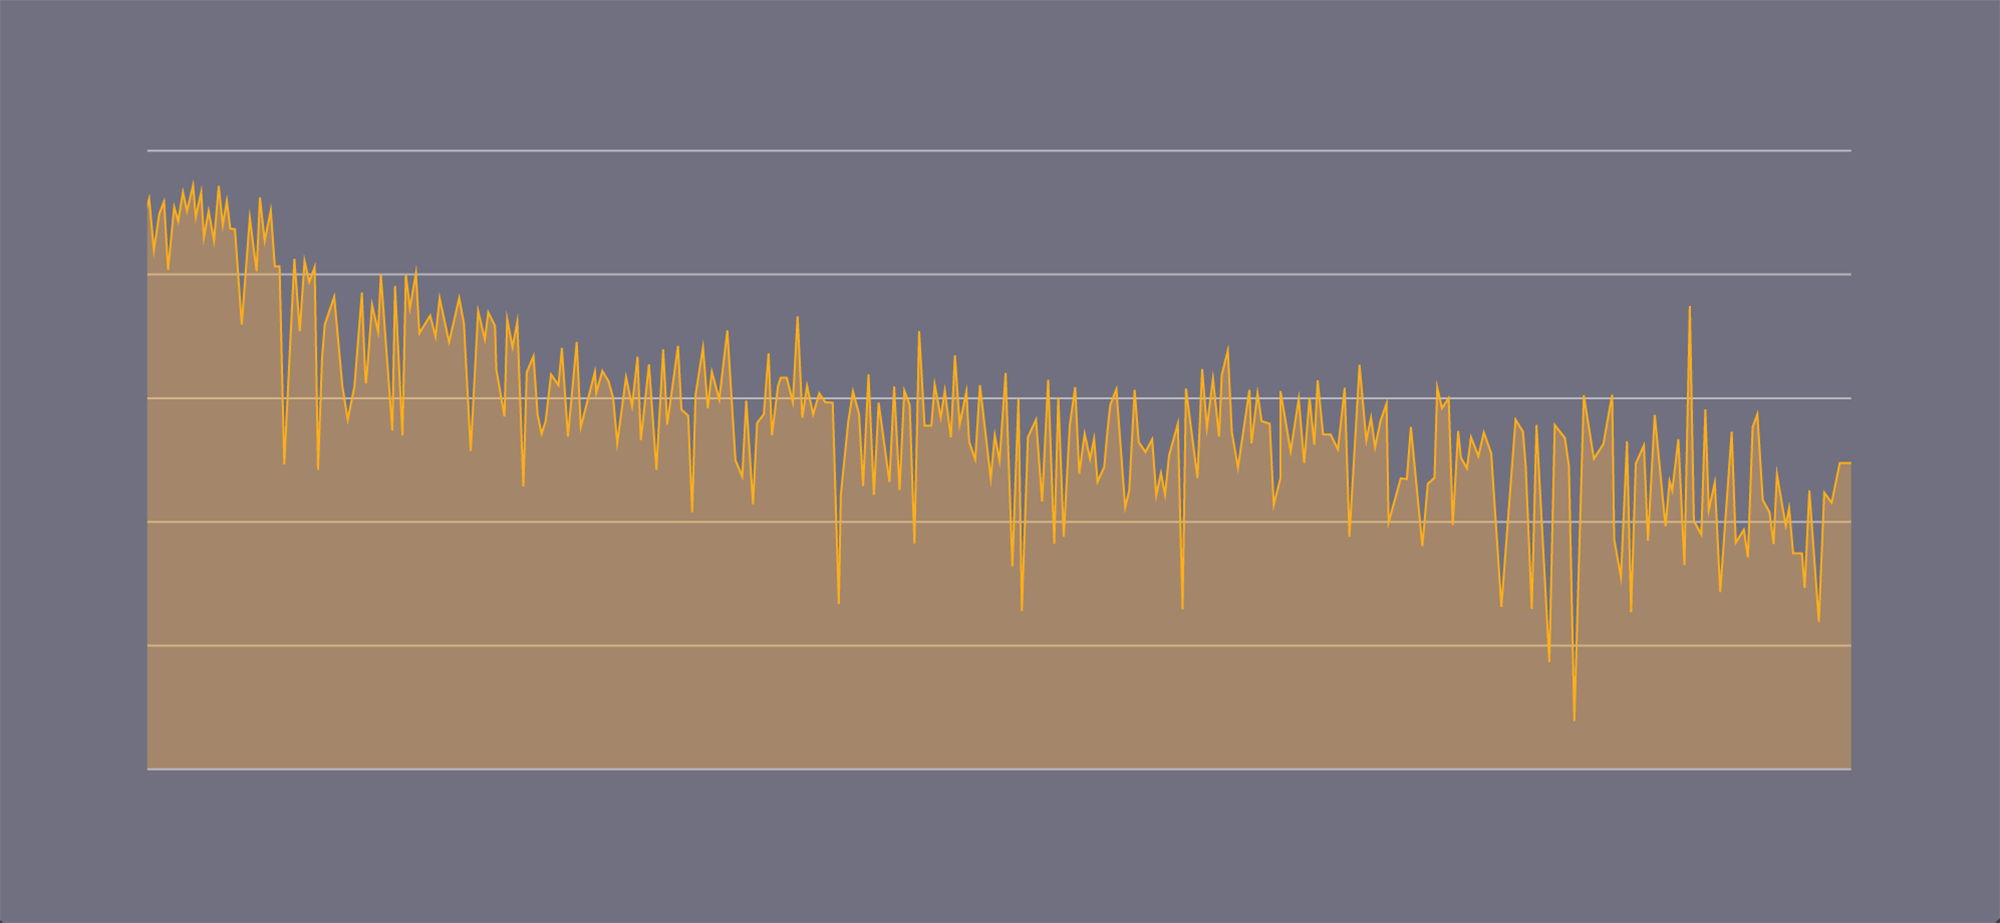
Graph showing MFLOPS over time while running a matrix multiplication CPU benchmark.
Android dynamically changes CPU frequency to improve battery life and phone temperature. This meant the speed of the phone was changing underneath us as the device heated up. Using the CPU governor settings of our phones, we were able to lock our CPUs at a fixed frequency so they could run indefinitely without overheating. We also built a similar benchmark for the GPU and locked it to a fixed frequency. This work resulted in much more consistent results from our benchmark.
chmod 666 \
    /sys/module/msm_thermal/core_control/enabled \
    /sys/module/cpu_boost/parameters/input_boost_freq \
    /sys/devices/fdb00000.qcom,kgsl-3d0/kgsl/kgsl-3d0/devfreq/governor \
    /sys/class/kgsl/kgsl-3d0/devfreq/min_freq \
    /sys/devices/fdb00000.qcom,kgsl-3d0/kgsl/kgsl-3d0/max_gpuclk \
    /sys/devices/system/cpu/cpu0/cpufreq/scaling_governor \
    /sys/devices/system/cpu/cpu1/cpufreq/scaling_governor \
    /sys/devices/system/cpu/cpu2/cpufreq/scaling_governor \
    /sys/devices/system/cpu/cpu3/cpufreq/scaling_governor

# Disable Android CPU optimization services
stop mpdecision
echo 0 > /sys/module/msm_thermal/core_control/enabled
echo 0 > /sys/module/cpu_boost/parameters/input_boost_freq

# Set fixed frequency for GPU
echo performance > /sys/devices/fdb00000.qcom,kgsl-3d0/kgsl/kgsl-3d0/devfreq/governor
echo 300000000 > /sys/class/kgsl/kgsl-3d0/devfreq/min_freq
echo 300000000 > /sys/devices/fdb00000.qcom,kgsl-3d0/kgsl/kgsl-3d0/max_gpuclk

# Set fixed frequency for CPU 0
echo performance > /sys/devices/system/cpu/cpu0/cpufreq/scaling_governor
echo 1728000 > /sys/devices/system/cpu/cpu0/cpufreq/scaling_max_freq
echo 1728000 > /sys/devices/system/cpu/cpu0/cpufreq/scaling_min_freq

# ... repeat for CPU 1-3
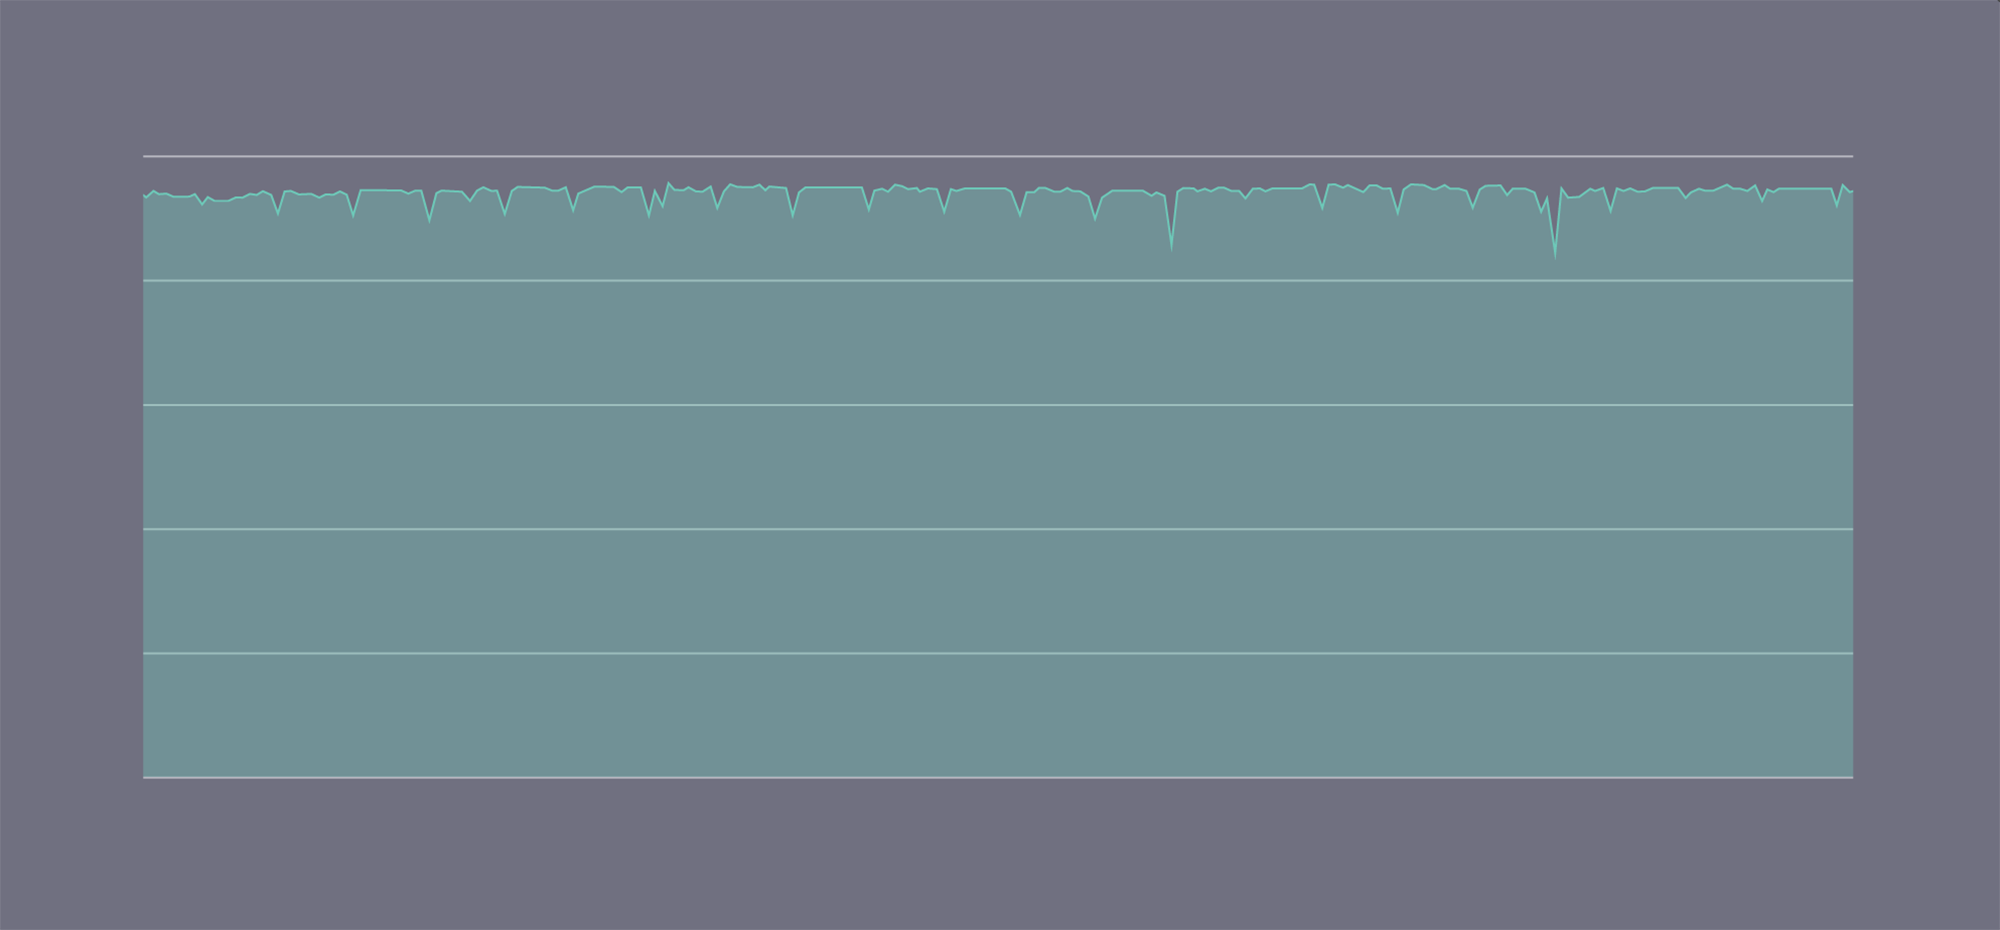
Stabilized MFLOPS while running benchmark with the CPU frequency at a fixed setting.
These simple benchmarks also allowed us to verify that performance across different devices of the same model is consistent when running at fixed frequency. Devices of the same model are fungible in our system.
Our benchmarks run continuously, like any other test, and run through the validation framework to ensure our platform remains high-quality. When we add a new device model to our lab, we use these benchmarks to find ideal governor settings for the new device model.
Consistent application performance
Our consistent benchmarks were helpful, but real applications are more than just a CPU-bound benchmark. For example, many interactions in our apps fetch information from Facebook’s servers using GraphQL. This means the performance characteristics of Facebook’s servers and their dependent services affect our benchmarks. If we happen to access Facebook.com at peak hours, pages may load slightly slower and alter our test results.
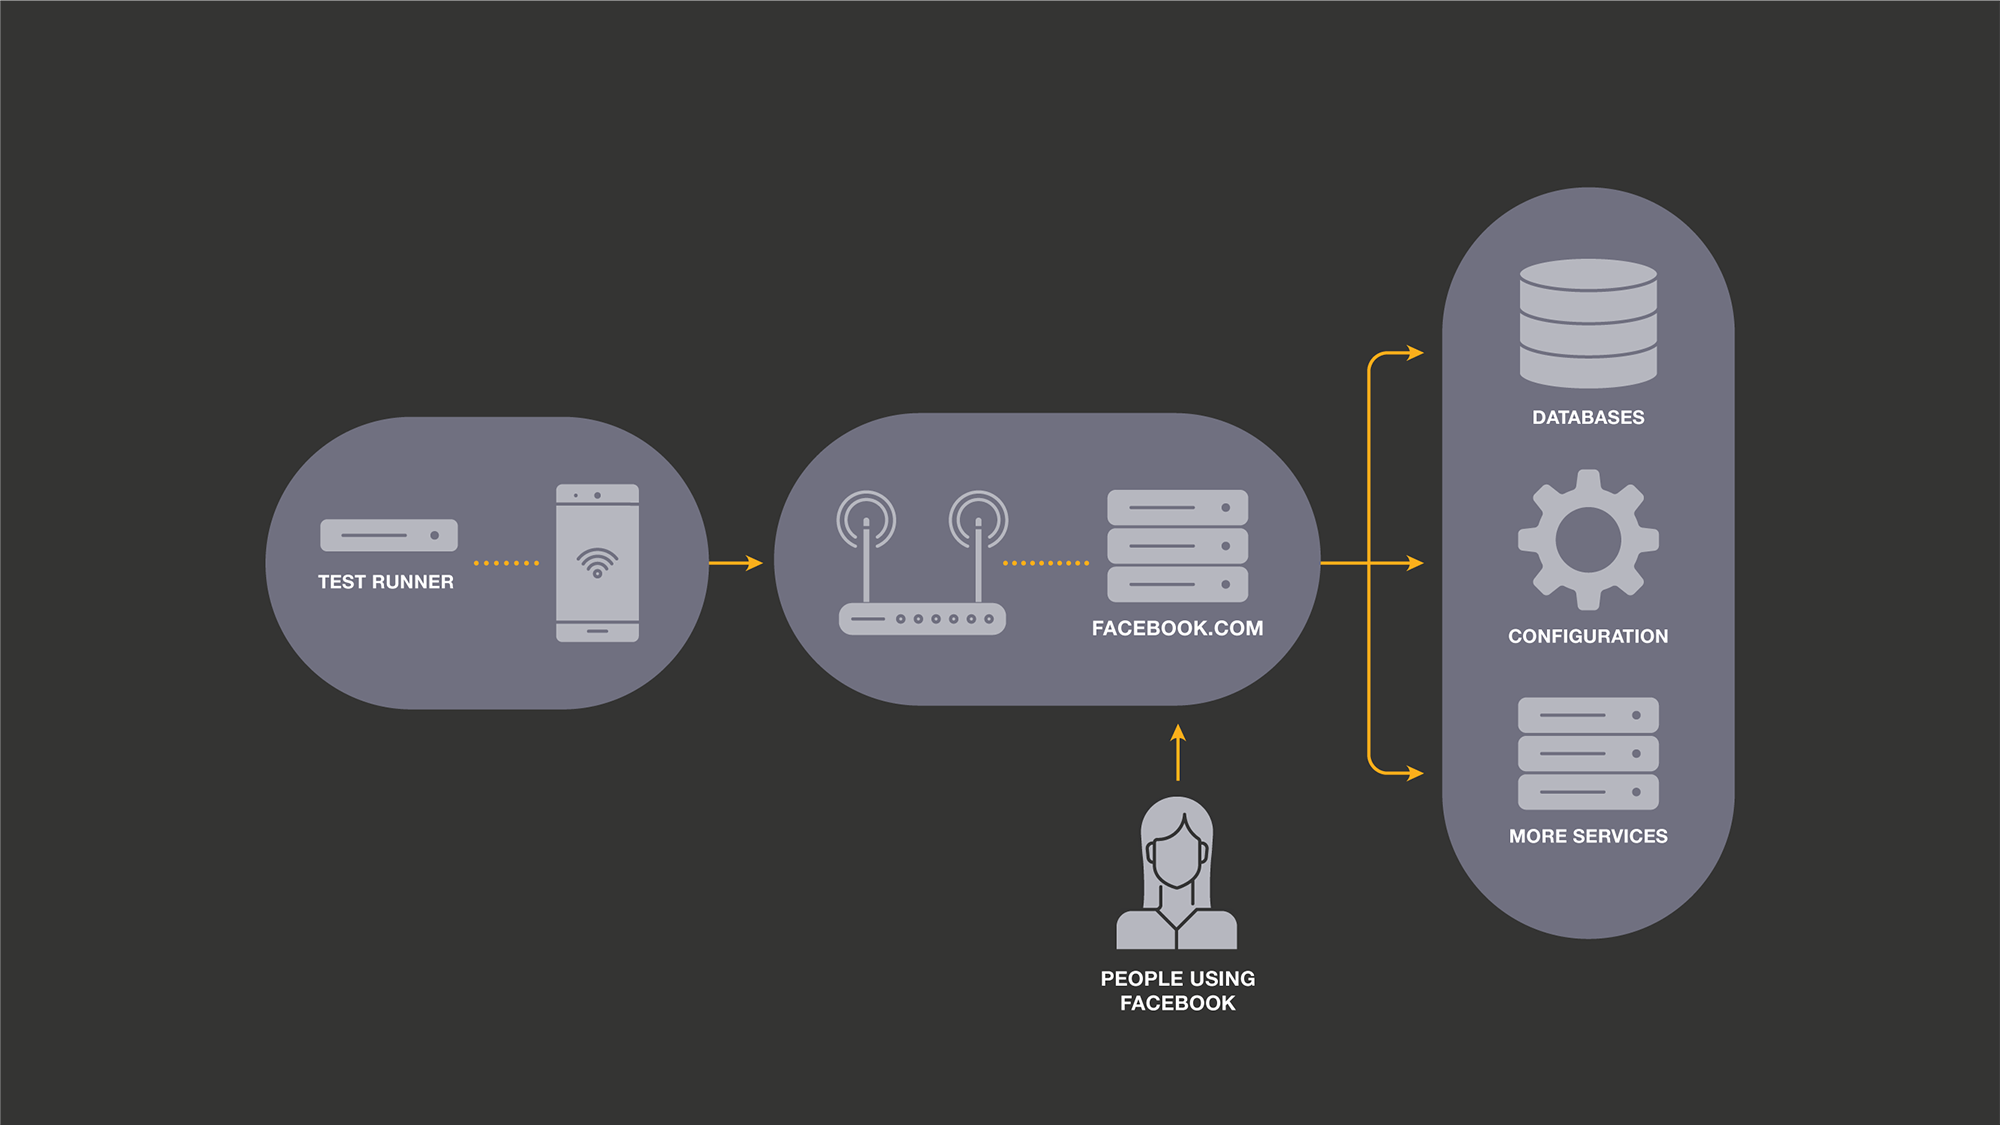
To isolate our system from these effects, we created an HTTP proxy server. The proxy server is provided to the device over USB via adb reverse. We record request and response pairs, which we can reuse to provide consistent data and timing to the benchmark. This approach is similar to BrowserLab, our web browser benchmarking system.
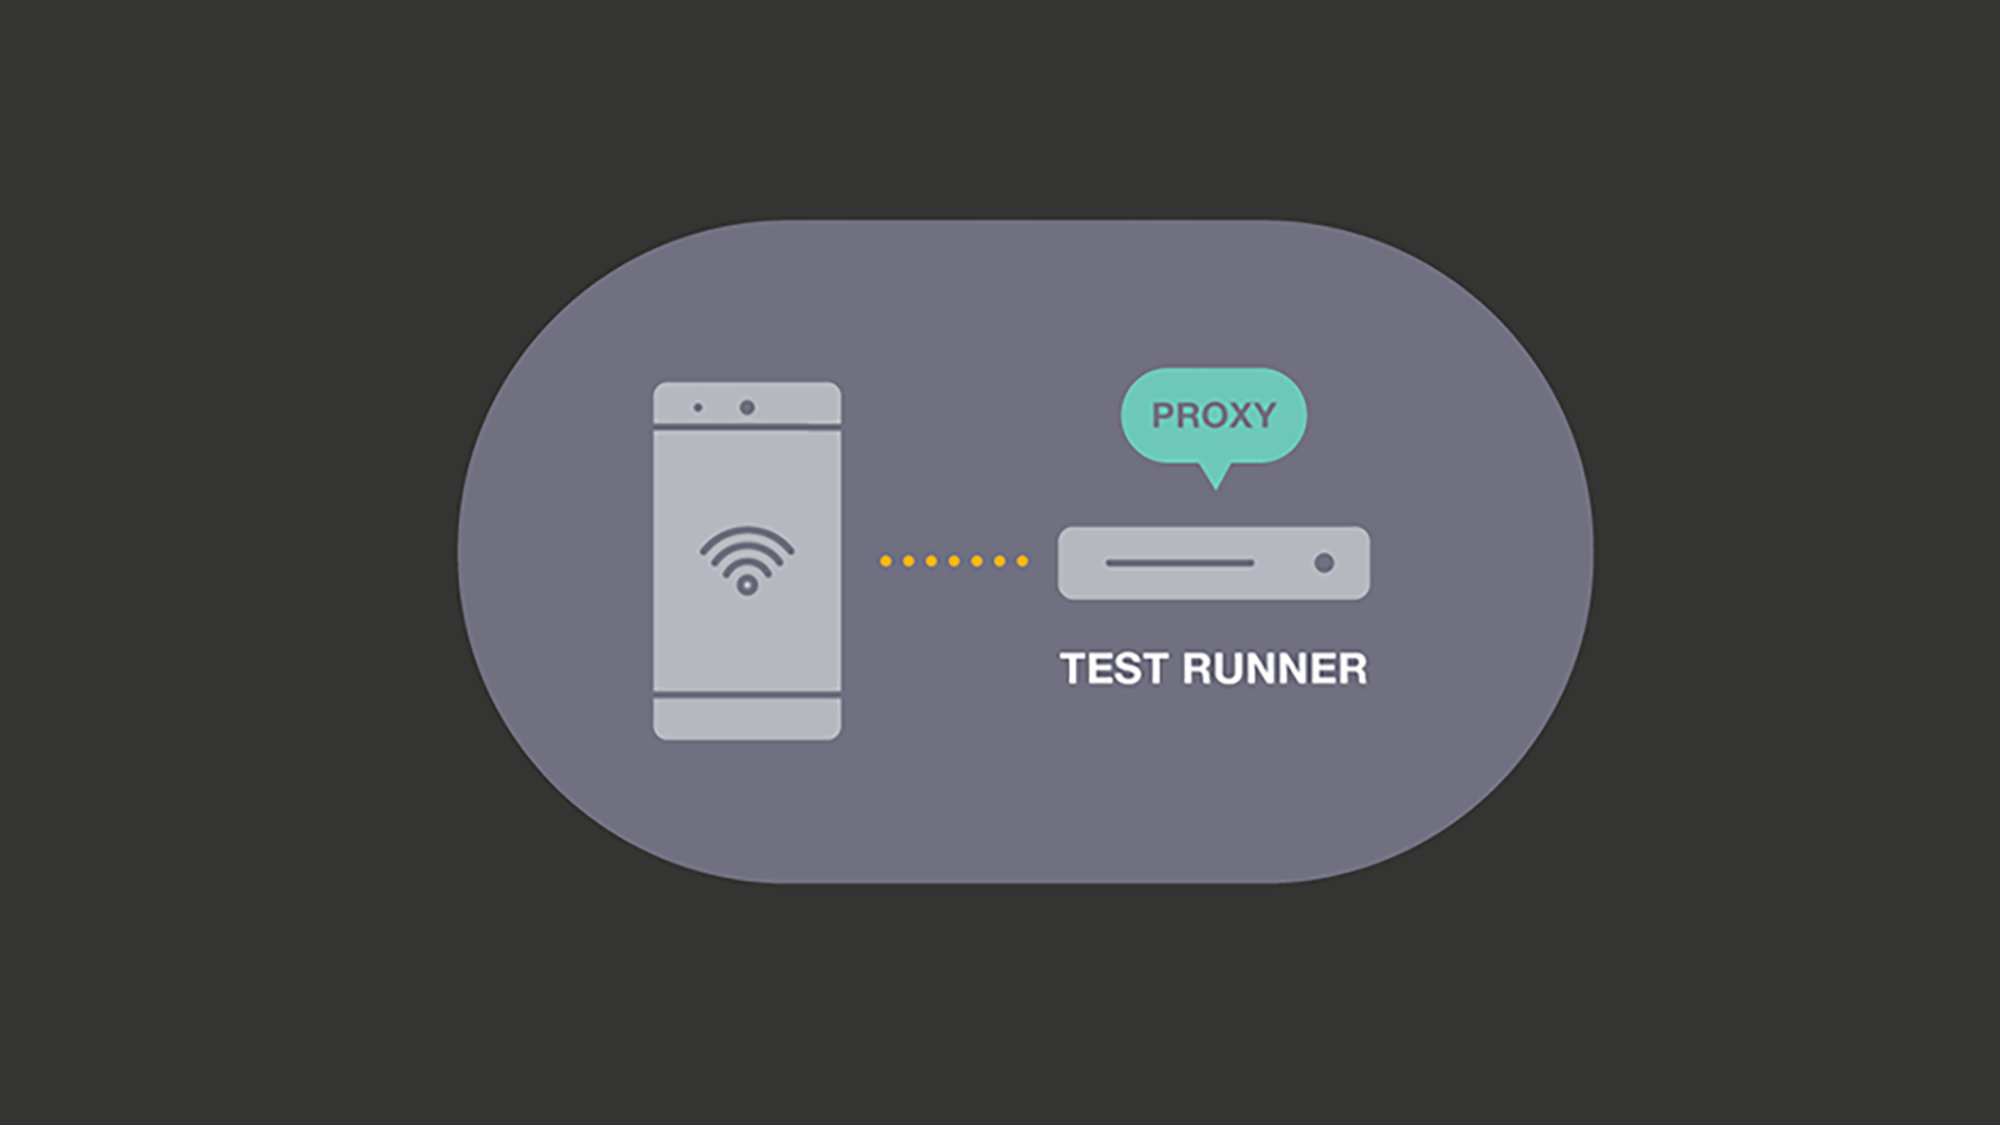
This proxy server significantly decreased noise in our system, but more important, it reduced the number of components involved, constraining it only to the Test Runner and phone. This facilitates reasoning about further sources of nondeterminism, as many components have already been eliminated.
Application state across trials
With our system free of external sources of noise, we pivoted to focus on application behavior. We began to notice consistent performance patterns across the trials within each experiment. For non-cold start tests, this could be an in-memory state of the application. But even cold start tests showed this pattern. During the test, the app was changing the state on the disk.
To control this, we now back up the on-disk state of the application before the first trial. Between each trial, we stop the application and restore this state. This means application state cannot be carried through between trials.
# Backup disk state
rm -rf /data/data/com.facebook.testsnapshot
cp -a \
    /data/data/com.facebook.katana \
    /data/data/com.facebook.testsnapshot
rm -rf /data/app/com.facebook.testsnapshot
cp -a \
    /data/app/com.facebook.katana-1 \
    /data/app/com.facebook.testsnapshot

# Restore disk state
rm -rf /data/data/com.facebook.katana
cp -a \
    /data/data/com.facebook.testsnapshot \
    /data/data/com.facebook.katana
rm -rf /data/app/com.facebook.katana-1
cp -a \
    /data/app/com.facebook.testsnapshot \
    /data/app/com.facebook.katana-1
Further optimizations
After all these optimizations, we returned to our earlier approach of studying Profilo traces. Our traces were no longer overwhelming, and we could easily spot individual blocks with higher variability. This enabled us to find several more sources of noise:
- Disk write performance: Because we run the same code repeatedly, disk reads normally hit the OS-level cache. Writes, however, do not. Disk performance is less consistent than CPU performance, so small writes contributed a surprising amount of noise. We solved this by remounting the app’s data directories to a RAM disk using tmpfs. Both our read and write performance are not realistic in this scenario, so we augment our latency metrics with I/O metrics such as classes loaded and bytes written.
- Device clock: Some application behavior depends on the system time; one example is code, which determines TTL for cache entries. If too much time had elapsed, the app would take different code paths and exhibit different performance characteristics. We corrected this by resetting the device’s clock to the same timestamp before each trial.
- Crash dialogs: In some rare cases, the app may crash during execution, resulting in the display of an Android crash dialog. Without further action, this dialog would remain on screen for the remainder of the test. The test would continue to function correctly, but the appearance of the dialog affected the app’s performance and produced slightly slower metrics. We fixed this by dismissing any dialogs before each trial.
- Eliminate logcat tailing: We originally communicated metrics via log lines written by the app and tailed logcat to receive these metrics. The test runner would know the test was complete once it read all of the expected metrics from these logs. Actively listening to logcat via adb causes additional noise during the testing process. We instead establish an
adb reversetunnel and have the app directly send metrics to the test runner via a socket connection.
Combining the aforementioned methods provides an experiment flow as shown below. With these changes, MobileLab successfully reduced variance in important performance tests by an order of magnitude and is able to reliably detect sub 1 percent regressions with only 50 trials.
set_fixed_cpu_gpu_frequency()
mount_tmpfs()
run_experiment(proxy_mode=Mode.RECORD, app=treatment, trials=1)
run_experiment(proxy_mode=Mode.RECORD, app=control, trials=1)
run_experiment(proxy_mode=Mode.REPLAY, app=treatment, trials=N)
run_experiment(proxy_mode=Mode.REPLAY, app=control, trials=N)

def run_experiment(proxy_mode, app, trials):
    # Setup
    proxy.set_mode(proxy_mode)
    app.install()

    performance_test.setup()
    app.capture_snapshot()

    # Benchmarking
    start_time = datetime.now()
    for trial in range(trials):
        app.restore_snapshot()
        set_device_time(start_time)
        performance_test.run()
        app.kill()
        dismiss_crash_dialog()
Testing with MobileLab
In our previous system, we used end-to-end correctness tests as our performance tests. End-to-end tests work well when you need to run the test once, but in a performance test running many times, this greatly increases the test duration. Additionally, each step may not be completely deterministic, resulting in high variance of an experiment. Test speed and accuracy were a major complaint about the old system.
In MobileLab, we instead provide a more limited and opinionated test API that encourages users to write tests that advance to the measurement as quickly and simply as possible. Unlike some end-to-end test frameworks, we do not poll for UI elements or load additional libraries into the application for testing. This removes all overhead from the framework.
def run_test():
    start_app()
    navigate_directly_to_interaction()
    wait_for_performance_marker()
In production, we set performance goals based on time taken for interactions to complete. It’s impossible in a lab environment to represent the huge combination of environments, devices, and connection speeds. So in many cases, we close these gaps by collecting additional metrics instead of creating more tests. Some examples of metrics we track are classes loaded, bytes read and written to disk, and memory allocated. Consumption metrics also help us understand more about the reasons timing metrics changed, saving investigation time.
Our approach of using noise reduction and consumption metrics results in a more synthetic benchmark that is less representative of all scenarios. Despite clear differences from production, we find that MobileLab is still able to find regressions that occur in real-world scenarios. Our focus is on being directionally correct, not to produce the same magnitude as production. We run every test, including continuous runs as an A/B test, reporting the difference between A and B, rather than the absolute value of one side.
Our accuracy improvements enable us to make better use of our device time and apply resources toward simulating more representative scenarios. For example, we can now run jobs to simulate different A/B product experiment combinations or News Feed story mixes. When MobileLab does not catch a regression that makes it to production, we use this information to address gaps in our lab coverage.
Automated regression detection
Using MobileLab’s highly accurate measurement system, we limit regressions shipped to production. We automatically run MobileLab on a continuous basis, running an hourly comparison of the current production branch to the master. We apply additional statistics to detect step changes in metrics and perform an automated bisect to find the code change that caused the regression. The bisect process integrates with our task tracking system by automatically alerting the engineer who authored the commit of the detected issue and blocking future releases until the regression is resolved. Because we release our apps weekly, it’s important that our detection and bisect process is fast and reliable, otherwise, we may not be able to fix a regression in time.
Conclusion
Our approach and the lessons we’ve learned in building MobileLab apply to many performance benchmarking scenarios, not only mobile. Namely, a methodical approach is necessary to evaluate system change; tools to make this easy accelerate progress, and breaking the problem down into smaller components and limiting the components in the system make it simpler to find and reduce noise. Our hope is that by sharing these learnings, others can find similar success.
These improvements to signal quality are helping us catch regressions that were previously undetectable, making MobileLab an important part of the workflow for performance teams at Facebook. For some teams, MobileLab has caught every regression that would have shipped to production, allowing their engineers to focus on speed improvements, instead of fighting regressions. Across all our apps, we have caught thousands of regressions that would otherwise require manual investigation by an engineer.